Part 2 of the series. Part 1 set up a separate bitcoind and LND on testnet4, next to the regtest lab.
The monitoring stack from Monitoring LND with systemd, Without Containers still watches the two regtest nodes. The node that matters now is the testnet4 one, so this part moves the monitoring over to it.
Retiring the regtest scrape job
Commenting out the lndmon job
The first change is in Prometheus’s configuration, edited with sudoedit as before:
sudoedit /etc/prometheus/prometheus.yml
The regtest lndmon job is commented out, each line prefixed with #, while the prometheus and node jobs stay:
global:
  scrape_interval: 15s
  evaluation_interval: 15s

scrape_configs:
  - job_name: prometheus
    static_configs:
      - targets: ['127.0.0.1:9090']

  - job_name: node
    static_configs:
      - targets: ['127.0.0.1:9100']
# - job_name: lndmon
#   static_configs:
#     - targets: ['127.0.0.1:9092']
#       labels:
#         node: a
#     - targets: ['127.0.0.1:9093']
#       labels:
#         node: b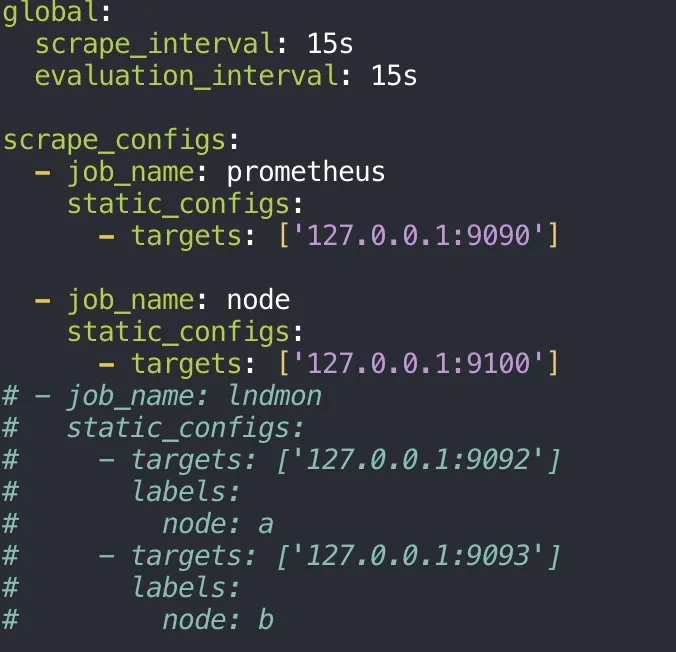
Commenting the job out rather than deleting it keeps the regtest targets one edit away, in case the regtest lab needs watching again. The history Prometheus already stored for job="lndmon" stays in its database either way; only new scrapes stop. The host metrics from node exporter and Prometheus’s own metrics carry on, since they describe the VM rather than either chain.
lndmon for testnet4
The files it needs
An exporter for the testnet4 node needs the same two files as the regtest ones: LND’s TLS certificate and its read-only macaroon. The check is the loop from the monitoring series, run as lnd-t4:
sudo -u lnd-t4 sh -c '
  for file in \
    /var/lib/lnd-testnet4/tls.cert \
    /var/lib/lnd-testnet4/data/chain/bitcoin/testnet4/readonly.macaroon
  do
    if test -r "$file"; then
      printf "readable: %s\n" "$file"
    else
      printf "not readable: %s\n" "$file"
    fi
  done
'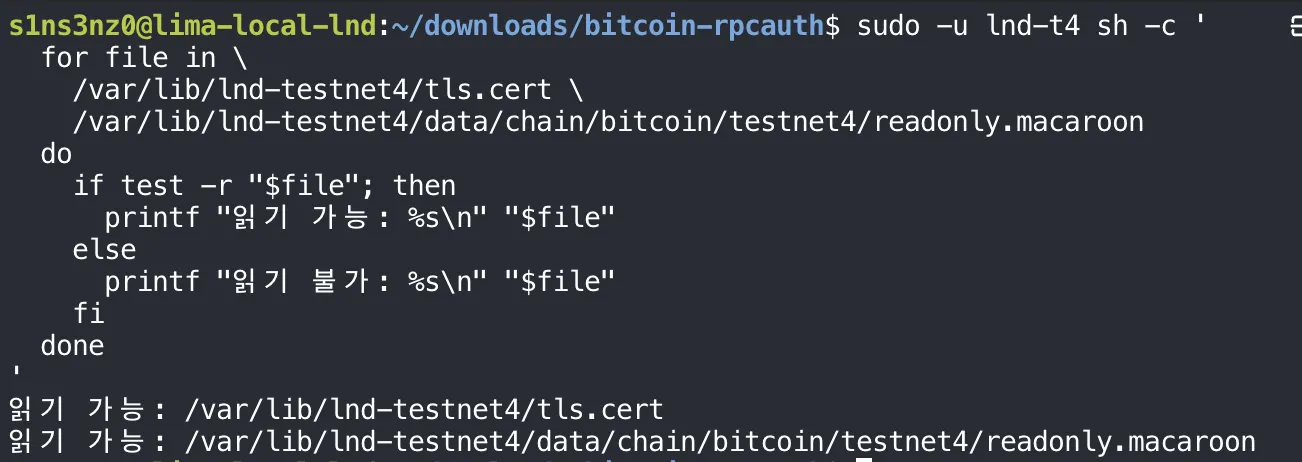
“읽기 가능” in the screenshot means “readable”.
Both files exist and lnd-t4 can read them. LND created them when it first started, and the macaroon’s path shows the network change: data/chain/bitcoin/testnet4/ where the regtest nodes had data/chain/bitcoin/regtest/. LND keeps its macaroons in a directory per network, so the path in lndmon’s --lnd.macaroondir has to name the network too.
A first run by hand
The same manual run as for the regtest nodes, with every value pointing at testnet4:
sudo -u lnd-t4 lndmon \
  --lnd.host=127.0.0.1:10011 \
  --lnd.network=testnet4 \
  --lnd.tlspath=/var/lib/lnd-testnet4/tls.cert \
  --lnd.macaroondir=/var/lib/lnd-testnet4/data/chain/bitcoin/testnet4 \
  --lnd.macaroonname=readonly.macaroon \
  --prometheus.listenaddr=127.0.0.1:9094 \
  --prometheus.logdir=/var/lib/lnd-testnet4/lndmon-log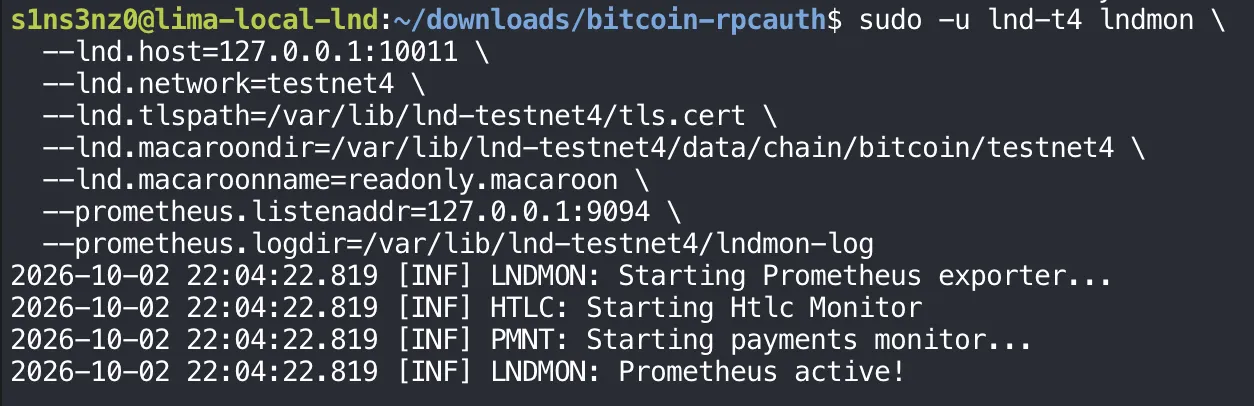
| Option | Regtest node A | Testnet4 |
|---|---|---|
| Run as | lnd | lnd-t4 |
--lnd.host | 127.0.0.1:10009 | 127.0.0.1:10011 |
--lnd.network | regtest | testnet4 |
--lnd.tlspath, --lnd.macaroondir | Under /var/lib/lnd, .../regtest | Under /var/lib/lnd-testnet4, .../testnet4 |
--prometheus.listenaddr | 127.0.0.1:9092 | 127.0.0.1:9094 |
--prometheus.logdir | /var/lib/lnd/lndmon-log | /var/lib/lnd-testnet4/lndmon-log |
The metrics port is 9094, the next one after the two regtest exporters on 9092 and 9093. --lnd.network=testnet4 matters as much as on regtest: lndmon’s default is mainnet, which would look for the wrong macaroon and talk about the wrong chain. The startup is identical to the regtest exporters’, ending in Prometheus active!, so lndmon reached testnet4’s LND over TLS with the read-only macaroon.
From a second shell, the endpoint on 9094:
curl -fsS http://127.0.0.1:9094/metrics |
  rg '^lnd_(chain_block_height|chain_synced|peer_count) '
| Metric | Value | Meaning |
|---|---|---|
lnd_chain_block_height | 99,420 | The height LND has followed bitcoind-testnet4 to. It was 67,062 at the end of Part 1 |
lnd_chain_synced | 0 | LND isn’t synced to the chain yet, the synced_to_chain: false from getinfo |
lnd_peer_count | 0 | No Lightning peers yet |
These look nothing like the regtest baseline of 1, 1, 1. On regtest, the metrics described a finished, healthy setup. Here they describe a node still catching up: a block height that keeps climbing, chain_synced waiting to flip to 1, and no peers. That’s exactly what makes them useful to chart. The sync itself will show up on the dashboard, and the moment lnd_chain_synced turns 1 will be visible as a step.
The unit
The manual run goes into lndmon-testnet4.service, shaped exactly like the regtest lndmon-a.service:
![sudo tee /etc/systemd/system/lndmon-testnet4.service >/dev/null <<'EOF' with [Unit] Description=LND testnet4 metrics exporter, Wants=lnd-testnet4.service, After=lnd-testnet4.service, StartLimitIntervalSec=0; [Service] Type=simple, User=lnd-t4, Group=lnd-t4, ExecStart=/usr/local/bin/lndmon with --lnd.host=127.0.0.1:10011, --lnd.network=testnet4, --lnd.tlspath=/var/lib/lnd-testnet4/tls.cert, --lnd.macaroondir=/var/lib/lnd-testnet4/data/chain/bitcoin/testnet4, --lnd.macaroonname=readonly.macaroon, --prometheus.listenaddr=127.0.0.1:9094, --prometheus.logdir=/var/lib/lnd-testnet4/lndmon-log, Restart=on-failure, RestartSec=5, UMask=0077, NoNewPrivileges=true, ProtectHome=true, ProtectSystem=full; [Install] WantedBy=multi-user.target](/_astro/lndmon-testnet4-unit.Dl9jmLCP_UoWcl.webp)
| Directive | lndmon-a.service (regtest) | lndmon-testnet4.service |
|---|---|---|
Description | LND A metrics exporter | LND testnet4 metrics exporter |
Wants, After | lnd.service | lnd-testnet4.service |
User, Group | lnd | lnd-t4 |
ExecStart options | Regtest node A’s host, files, and port 9092 | The testnet4 values from the manual run, port 9094 |
Everything else is the same, including StartLimitIntervalSec=0, which matters more here than it did on regtest. If the VM reboots, LND comes back with its wallet locked until someone unlocks it, and lndmon can’t get data from a locked node. Without the start limit turned off, systemd would give up on lndmon after a few quick failures. With it off, lndmon keeps retrying every five seconds and starts reporting as soon as the wallet is unlocked.
The dependency chain for the testnet4 stack is now complete: lndmon-testnet4 wants lnd-testnet4, which wants bitcoind-testnet4.
Checking and starting it
sudo systemd-analyze verify /etc/systemd/system/lndmon-testnet4.service
sudo systemctl daemon-reload
sudo systemctl restart lndmon-testnet4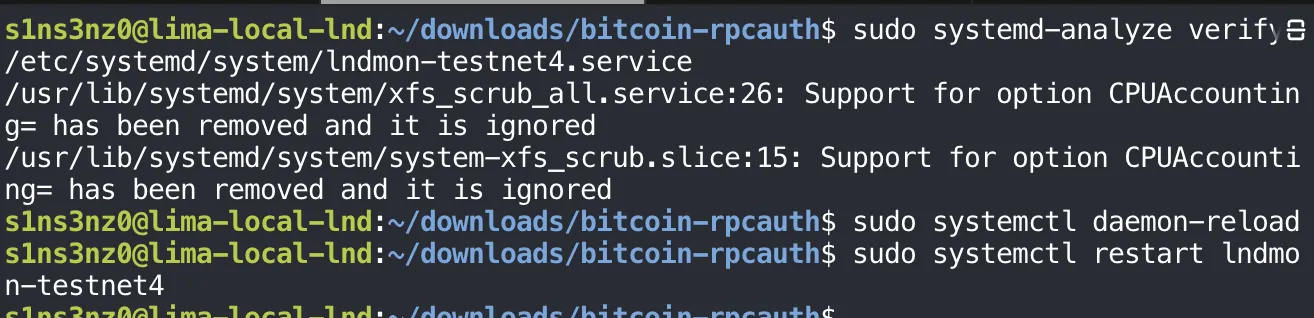
verify flags only the two Ubuntu XFS units seen every time before, nothing in the new file. With the manual run stopped so port 9094 is free, restart brings the service up. On a unit that isn’t running, restart simply starts it, so it works the same as start here and is a habit that also covers the case where an older instance is still running.
systemctl status lndmon-testnet4 --no-pager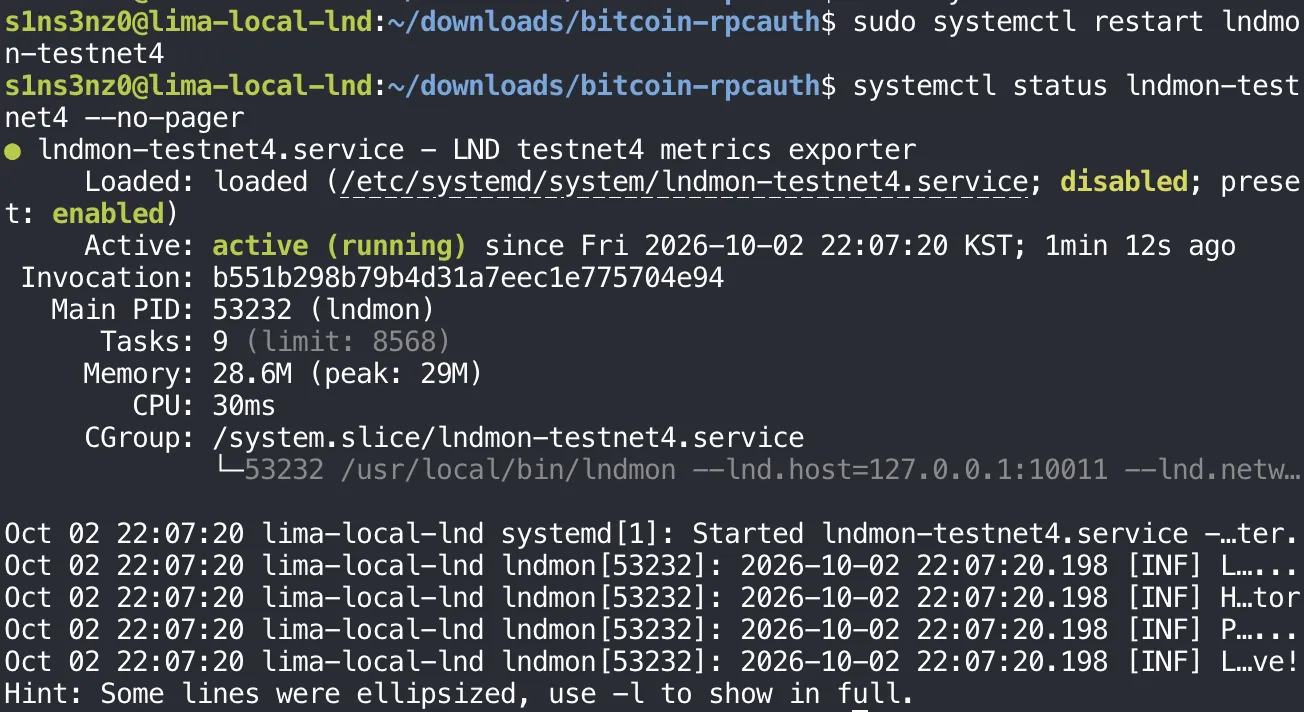
| Line | Meaning |
|---|---|
active (running), Main PID: 53232 (lndmon) | The exporter is up as a service, its own process under systemd |
CGroup: … --lnd.host=127.0.0.1:10011 … | Started with the testnet4 options from the unit |
Four journal lines ending L…ve! | The same four startup lines as the manual run, ending in Prometheus active!, cut short because -l was left off |
Loaded: … disabled | Running now, but not yet set to start at boot |
sudo systemctl enable lndmon-testnet4
Now the exporter starts at every boot. Because of Wants=lnd-testnet4.service, so does testnet4’s LND, and through LND’s own Wants=, bitcoind-testnet4, even though lnd-testnet4 hasn’t been enabled directly. LND will still come up with its wallet locked, and lndmon will keep retrying until it’s unlocked.
Scraping the testnet4 exporter
The new scrape job
Back in prometheus.yml, the lndmon job returns with a single target, the testnet4 exporter:
cat /etc/prometheus/prometheus.yml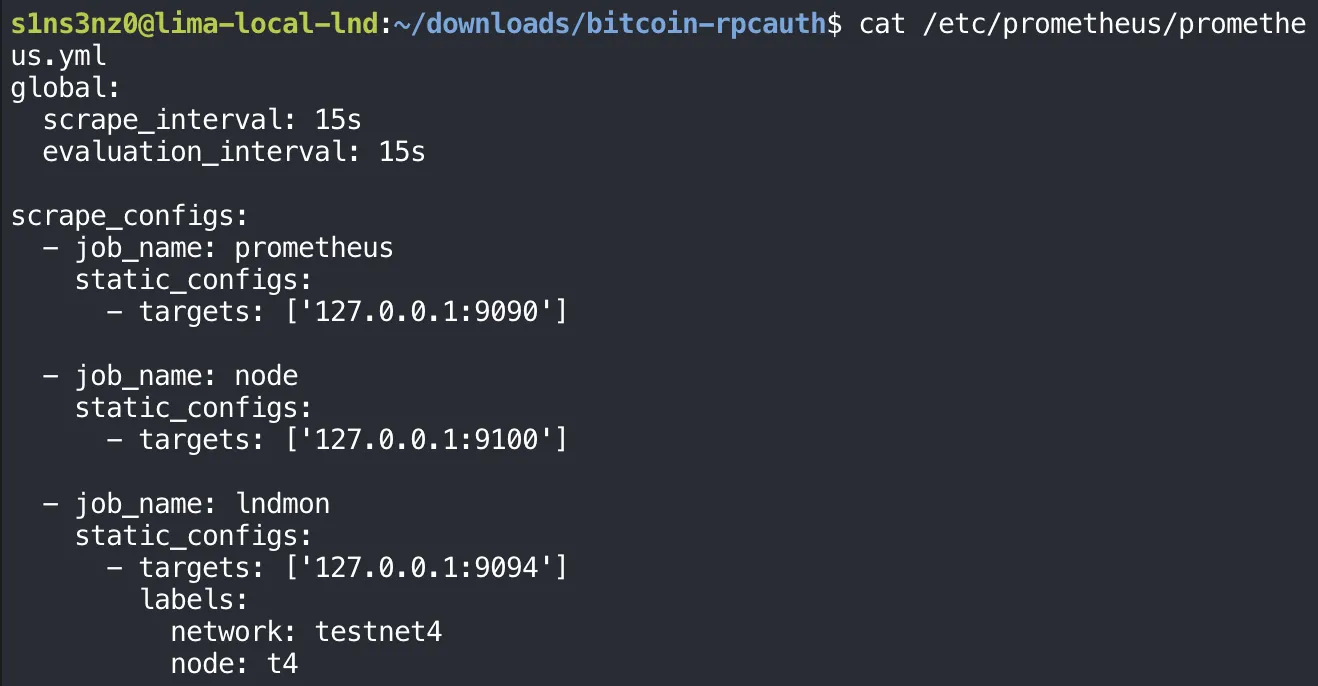
| Regtest (before) | Testnet4 (now) | |
|---|---|---|
| Job | lndmon | lndmon |
| Targets | 127.0.0.1:9092, 127.0.0.1:9093 | 127.0.0.1:9094 |
| Labels | node: a, node: b | network: testnet4, node: t4 |
The job keeps its name, so the Grafana queries built on {job="lndmon"} keep working without changes. The new network label is what tells the two eras apart. Prometheus still holds the regtest series from before, labeled job="lndmon" with node="a" or node="b" and no network at all. The testnet4 series carry network="testnet4", so a query can pick out just the testnet4 node with {job="lndmon", network="testnet4"} even when its time range reaches back into the regtest history.
promtool check config /etc/prometheus/prometheus.yml
promtool accepts it, so the file is safe to load.
Reloading Prometheus
sudo systemctl reload prometheus
As in the monitoring series, reload sends SIGHUP and Prometheus re-reads the file without a restart, so the stored history and the scrapes of the other jobs carry on uninterrupted. From the next scrape, it stops asking 9092 and 9093 and starts asking 9094.
Then a query that uses the new label, asking only about the testnet4 target:
curl -fsSG http://127.0.0.1:9090/api/v1/query \
  --data-urlencode 'query=up{job="lndmon",network="testnet4"}' |
python3 -m json.tool![curl -fsSG http://127.0.0.1:9090/api/v1/query --data-urlencode 'query=up{job="lndmon",network="testnet4"}' piped into python3 -m json.tool returns status success, resultType vector, one result: up with instance 127.0.0.1:9094, job lndmon, network testnet4, node t4, value [1790946725.24, "1"]](/_astro/up-testnet4.Dp0XsweN_Z1ixzpj.webp)
| Label | Value | Where it came from |
|---|---|---|
instance | 127.0.0.1:9094 | The target address, added by Prometheus |
job | lndmon | The job name |
network | testnet4 | The new label from the scrape configuration |
node | t4 | Likewise |
One result, with up at 1: Prometheus is scraping the testnet4 exporter, and the network="testnet4" selector finds it. The regtest targets no longer appear because they’re no longer scraped; up is only recorded for targets in the current configuration.
Grafana: the dashboards lndmon ships
What’s in the repository
Instead of building every panel by hand as in the monitoring series, this time I’m using the dashboards that come with lndmon. They’re in the repository cloned in that series:
rg --files ~/src/lndmon/grafana |
  rg '\.(json|yaml|yml)$'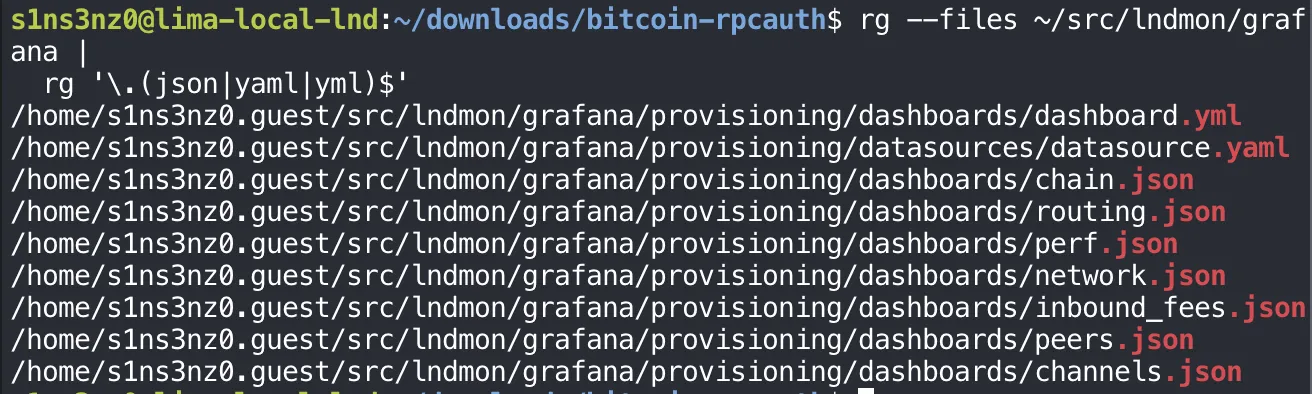
rg --files lists every file under the directory, and the second rg keeps the configuration and dashboard files:
| File | What it is (the dashboards going by their names, until they’re loaded) |
|---|---|
provisioning/datasources/datasource.yaml | A Grafana data source definition for Prometheus |
provisioning/dashboards/dashboard.yml | A provider definition that tells Grafana where to load dashboard files from |
chain.json | Chain and sync state |
channels.json | Channels and balances |
peers.json | Peer connections |
network.json | The Lightning network graph |
routing.json | Payment forwarding |
inbound_fees.json | Inbound fee policies |
perf.json | Performance |
The layout follows Grafana’s provisioning format: rather than clicking through the UI, Grafana reads data sources and dashboards from files at startup. The seven dashboards cover far more than the four panels I built for regtest, which suits a node that’s going to stay up on a public network.
Reading the files before using them
These files were written for lndmon’s Docker Compose setup. Before copying anything into Grafana, a short Python script prints the two YAML files and, for each dashboard, its title, the panel types it uses, and every data source it refers to:
import json
from pathlib import Path

base = Path.home() / "src/lndmon/grafana/provisioning"

for f in sorted(base.rglob("*.yaml")) + sorted(base.rglob("*.yml")):
    print(f"\n--- {f.name} ---")
    print(f.read_text())

for f in sorted((base / "dashboards").glob("*.json")):
    d = json.loads(f.read_text())
    types, sources = set(), set()

    def walk(value):
        if isinstance(value, dict):
            if "targets" in value and "type" in value:
                types.add(value["type"])
            if "datasource" in value:
                sources.add(json.dumps(value["datasource"], ensure_ascii=False))
            for child in value.values():
                walk(child)
        elif isinstance(value, list):
            for child in value:
                walk(child)

    walk(d)
    print(f"\n{f.name}: {d.get('title')}")
    print("panel types:", ", ".join(sorted(types)))
    print("datasources:", ", ".join(sorted(sources)))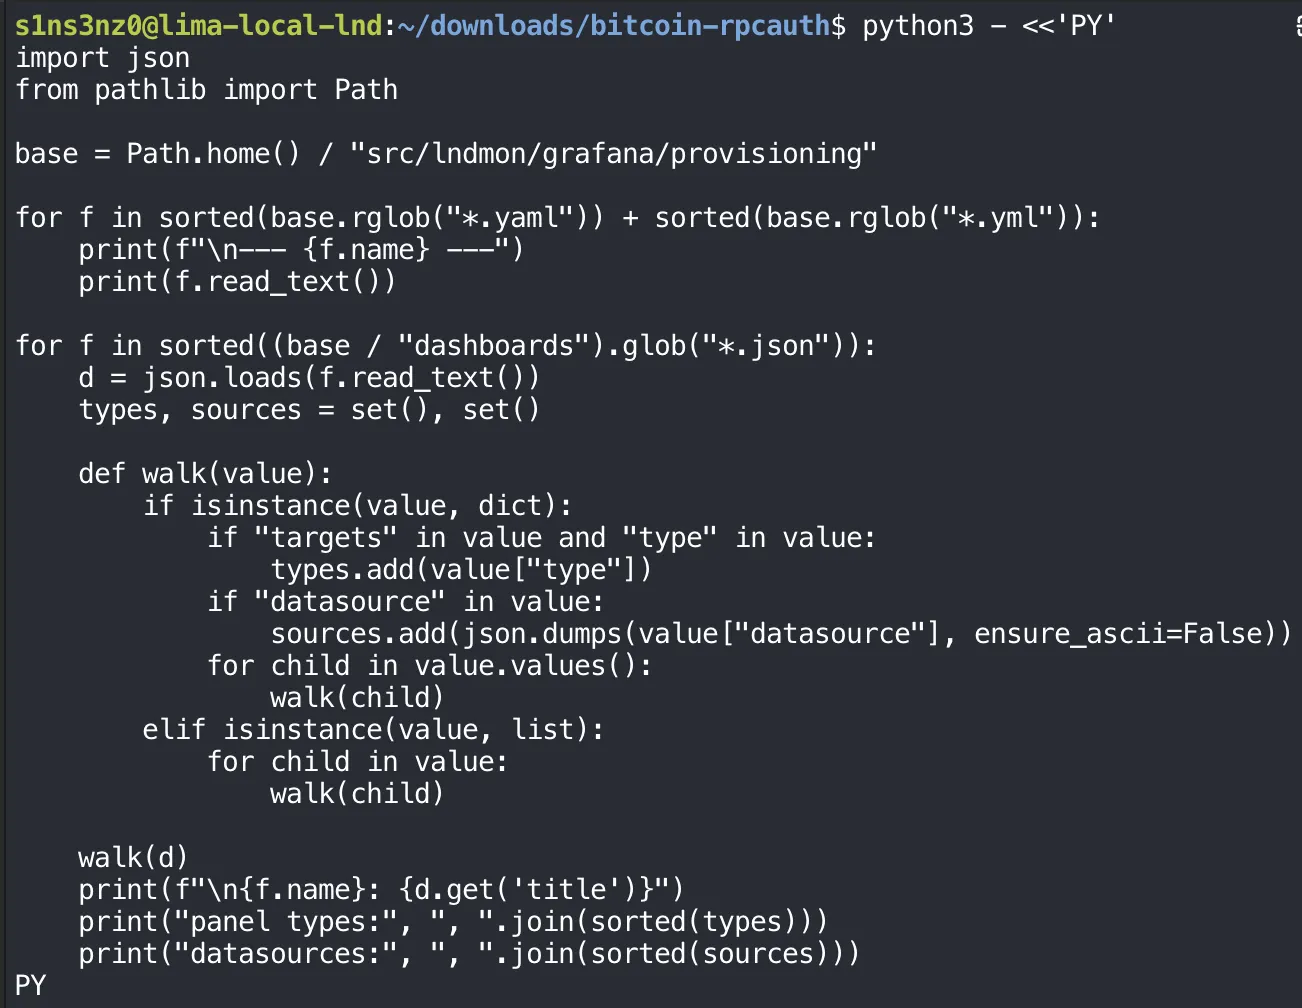
walk goes through the whole JSON tree. An object with both targets and type is a panel, so its type is collected; any datasource value anywhere is collected too. Only the standard library is used.
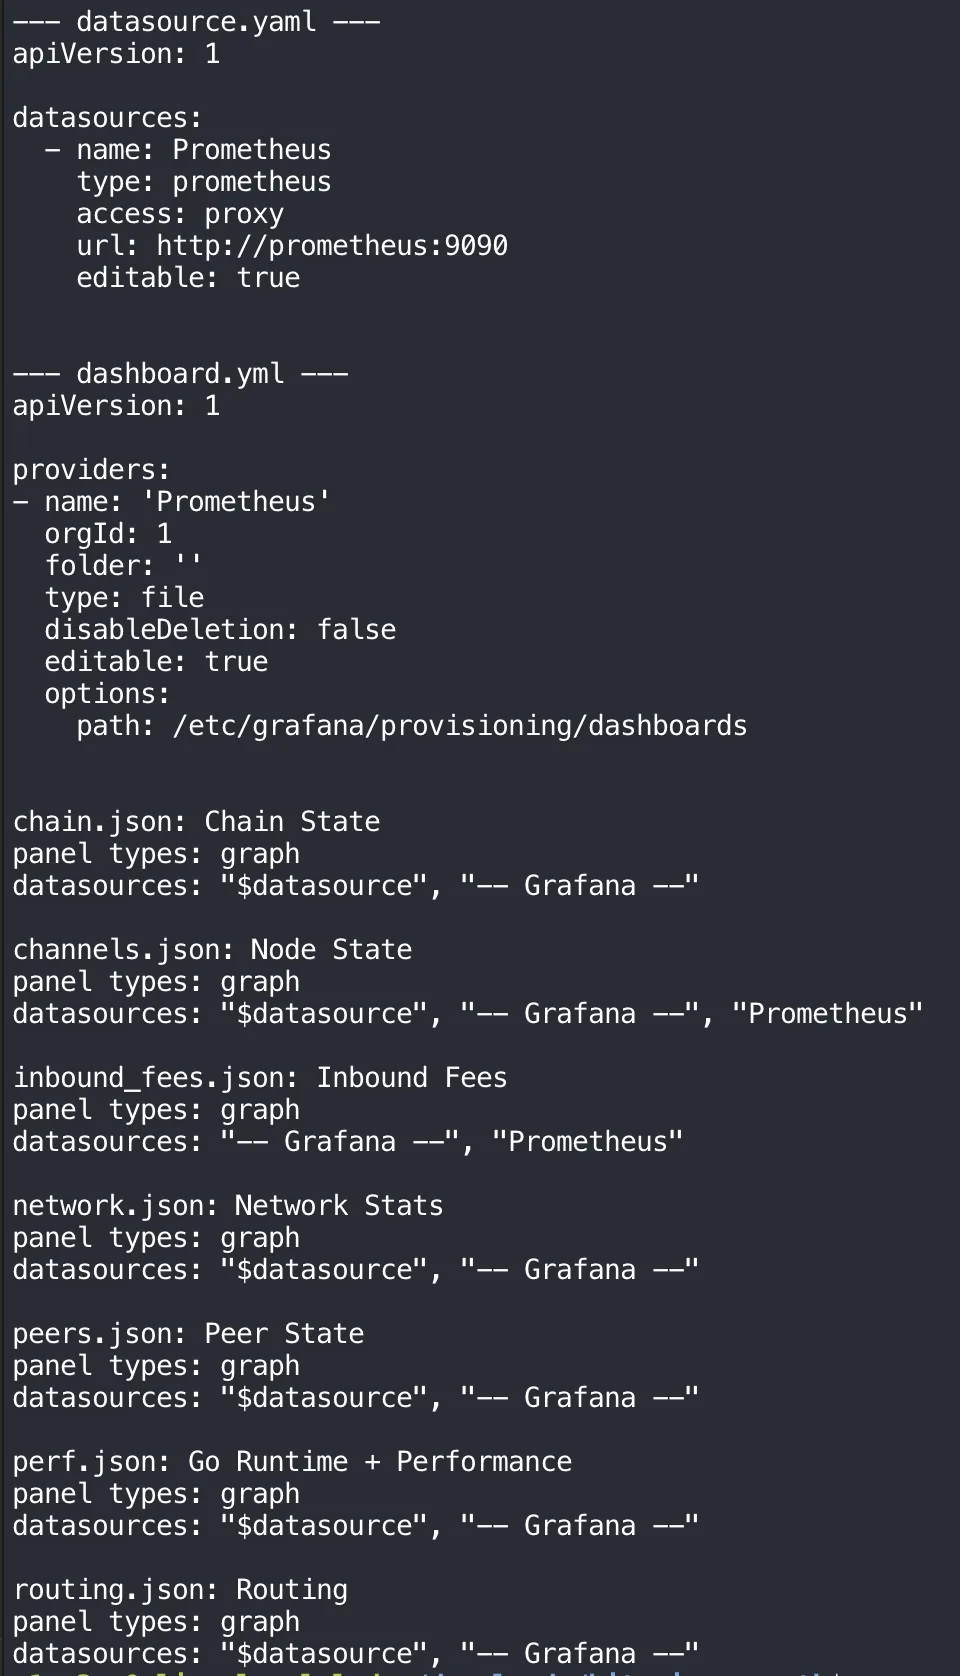
The dashboards, by their real titles:
| File | Title |
|---|---|
chain.json | Chain State |
channels.json | Node State |
inbound_fees.json | Inbound Fees |
network.json | Network Stats |
peers.json | Peer State |
perf.json | Go Runtime + Performance |
routing.json | Routing |
And five things that don’t fit this VM as they are:
| Finding | Why it matters here |
|---|---|
url: http://prometheus:9090 in datasource.yaml | prometheus is the service’s name on a Docker Compose network. There’s no such host in this VM; Prometheus is at http://127.0.0.1:9090 |
Data source named Prometheus | The data source I created by hand in the monitoring series is prometheus, lowercase. Provisioning this file as is would add a second data source for the same server |
"Prometheus" hard-coded in channels.json and inbound_fees.json | Most panels use the $datasource variable, which can point at any Prometheus data source. These two refer to one by the exact name Prometheus and won’t find prometheus |
Every panel is type graph | Grafana’s old graph panel. Recent Grafana versions replace it with the time series panel, so these dashboards depend on Grafana converting them when they load |
path: /etc/grafana/provisioning/dashboards in dashboard.yml | Inside the Docker image the JSON files are mounted there. Here they’d have to be copied there, or the path changed |
-- Grafana -- isn’t a problem: it’s Grafana’s built-in source for annotations, present in every installation.
The fix is mostly a matter of names and addresses: one data source, called Prometheus, pointing at 127.0.0.1:9090, and the dashboard files somewhere Grafana reads them.
The data source that already exists
Rather than provisioning lndmon’s datasource.yaml, the plan is to keep the data source created by hand in the monitoring series and point the dashboards at it. That needs its exact identity, which Grafana’s API returns:
curl -fsS -u admin http://127.0.0.1:3000/api/datasources |
  python3 -c '
import json, sys
for source in json.load(sys.stdin):
    if source["type"] == "prometheus":
        print("name:", source["name"])
        print("uid:", source["uid"])
        print("url:", source["url"])
'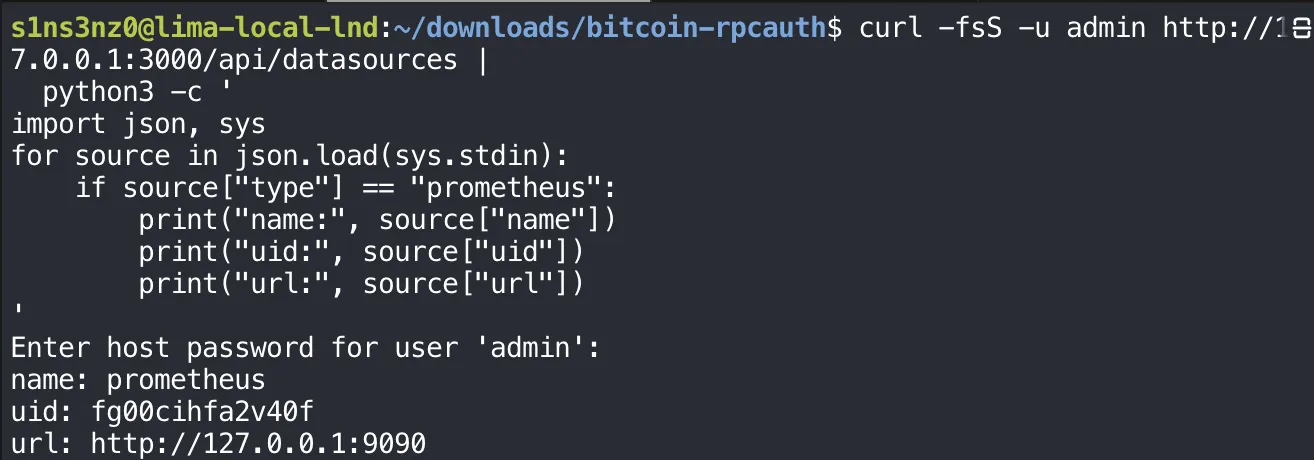
| Part | Meaning |
|---|---|
-u admin | Log in to the API as Grafana’s admin user. With no password on the command line, curl prompts for it, so it stays out of the shell history and the process list |
/api/datasources | Every data source Grafana has, as JSON |
The python3 -c script | Keep only the Prometheus ones and print three fields |
| Field | Value | Meaning |
|---|---|---|
name | prometheus | The display name, the one channels.json and inbound_fees.json don’t match |
uid | fg00cihfa2v40f | Grafana’s stable identifier for this data source. Dashboards can refer to it by uid, which doesn’t change if the name does |
url | http://127.0.0.1:9090 | Already the right address, unlike the http://prometheus:9090 in lndmon’s file |
There’s exactly one Prometheus data source, and it already points at the right place. The dashboards are what needs adjusting, not the data source.
A directory for the dashboards
lndmon’s dashboard.yml expects the JSON files in /etc/grafana/provisioning/dashboards, the directory where provider definitions also live. I gave the dashboards a directory of their own instead:
sudo install -d -o root -g grafana -m 0750 /etc/grafana/dashboards/lndmon-testnet4
The same ownership pattern as every configuration directory in these series: root owns it and can change it, the grafana group can read it, and nobody else can. Grafana runs as grafana, so it can load the dashboards but not rewrite them on disk. Keeping them in lndmon-testnet4/ separates them from the provisioning definitions and from any other dashboards added later.
Copying the dashboards, pointed at the right data source
One Python script copies all seven dashboards into the new directory and fixes their data source references on the way:
import json
import os
import grp
from pathlib import Path

source = Path("/home/s1ns3nz0.guest/src/lndmon/grafana/provisioning/dashboards")
destination = Path("/etc/grafana/dashboards/lndmon-testnet4")
datasource = {"type": "prometheus", "uid": "fg00cihfa2v40f"}
grafana_gid = grp.getgrnam("grafana").gr_gid

def update(value):
    if isinstance(value, dict):
        for key, child in list(value.items()):
            if key == "datasource":
                builtin = (
                    child == "-- Grafana --"
                    or isinstance(child, dict) and child.get("type") == "grafana"
                )
                if not builtin:
                    value[key] = datasource.copy()
            else:
                update(child)
    elif isinstance(value, list):
        for child in value:
            update(child)

for file in sorted(source.glob("*.json")):
    dashboard = json.loads(file.read_text())
    update(dashboard)

    dashboard["id"] = None
    dashboard["uid"] = "lndmon-t4-" + file.stem
    dashboard["title"] += " (testnet4)"
    dashboard.pop("__inputs", None)

    variables = dashboard.get("templating", {}).get("list", [])
    for variable in variables:
        if variable.get("type") == "datasource":
            variable.update({
                "type": "constant",
                "query": datasource["uid"],
                "current": {"text": "prometheus", "value": datasource["uid"]},
                "options": [{"text": "prometheus", "value": datasource["uid"], "selected": True}],
                "hide": 2
            })

    output = destination / file.name
    output.write_text(json.dumps(dashboard, indent=2) + "\n")
    os.chown(output, 0, grafana_gid)
    os.chmod(output, 0o640)
    print(output.name, "→", dashboard["title"])
It ran as root (sudo python3 - <<'PY'), since the destination belongs to root, and printed one line per dashboard:
chain.json → Chain State (testnet4)
channels.json → Node State (testnet4)
inbound_fees.json → Inbound Fees (testnet4)
network.json → Network Stats (testnet4)
peers.json → Peer State (testnet4)
perf.json → Go Runtime + Performance (testnet4)
routing.json → Routing (testnet4)
What it changes in each dashboard, and why:
| Change | Why |
|---|---|
Every datasource becomes {"type": "prometheus", "uid": "fg00cihfa2v40f"} | Fixes both the hard-coded "Prometheus" in two dashboards and the $datasource references: every panel now names the existing data source by its uid, which doesn’t depend on its name |
-- Grafana -- and type: grafana are left alone | That’s the built-in annotation source, not Prometheus |
The $datasource variable becomes a hidden constant | A query that still says $datasource resolves to the same uid, and with hide: 2 there’s no data source picker on the dashboard to change it by mistake |
id: null | Grafana assigns its own database id when it loads the file |
uid: "lndmon-t4-<file>" | A stable, readable identifier per dashboard, e.g. lndmon-t4-chain, unique even if lndmon’s dashboards are loaded again for another node |
Title gets (testnet4) | Says on screen which node a dashboard is about |
__inputs removed | That block is for interactive imports, asking which data source to use; provisioned files don’t need it |
Owner root:grafana, mode 0640 | Same as the directory: Grafana reads the files, root alone can change them |
The script recurses through the JSON the same way the inspection script did, so it catches datasource keys at any depth: on panels, on individual queries, and on annotations.
Where the files live
Grafana’s dashboard provisioning has two kinds of file, and they go in different places:
/etc/grafana/
├── provisioning/dashboards/
│   └── lndmon-testnet4.yaml   ← the provider: tells Grafana where to look
└── dashboards/lndmon-testnet4/
    ├── chain.json             ← the dashboards themselves
    ├── peers.json
└── ...| File | Role |
|---|---|
provisioning/dashboards/lndmon-testnet4.yaml | A provider definition. Grafana reads every file in provisioning/dashboards/ at startup; this one says “load the dashboards in /etc/grafana/dashboards/lndmon-testnet4” |
dashboards/lndmon-testnet4/*.json | The seven adjusted dashboards, which the provider points to |
lndmon’s own dashboard.yml mixed the two, pointing the provider at the same directory provider files live in. Separating them means the provisioning directory holds only small registration files, one per set of dashboards, and each set has its own folder.
The provider file
sudo cat /etc/grafana/provisioning/dashboards/lndmon-testnet4.yaml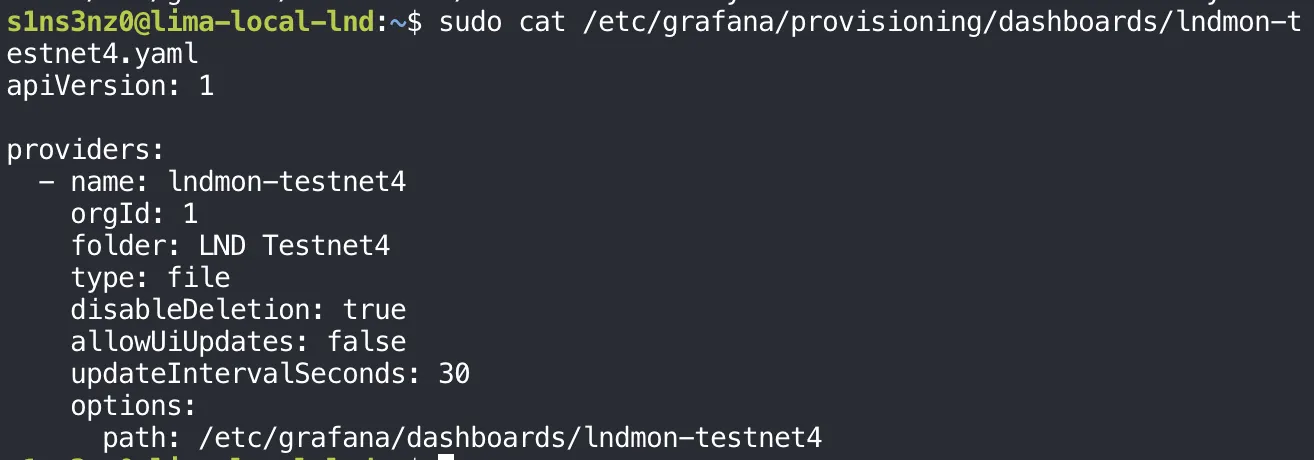
| Setting | lndmon’s dashboard.yml | Mine | Meaning |
|---|---|---|---|
name | Prometheus | lndmon-testnet4 | The provider’s own name, which says what it loads |
folder | '' (top level) | LND Testnet4 | The Grafana folder the dashboards appear in |
type | file | file | Load dashboards from JSON files on disk |
disableDeletion | false | true | The dashboards can’t be deleted from Grafana’s UI |
editable / allowUiUpdates | editable: true | allowUiUpdates: false | Changes made in the UI can’t be saved over the provisioned version |
updateIntervalSeconds | Not set | 30 | Grafana rechecks the directory every 30 seconds, so edits to the JSON files show up without a restart |
options.path | /etc/grafana/provisioning/dashboards | /etc/grafana/dashboards/lndmon-testnet4 | Where the JSON files are |
lndmon’s file leaves its dashboards open to editing in the UI. Mine makes the files on disk the only source of truth: the dashboards can’t be deleted or overwritten from the browser, and changing one means changing its JSON, owned by root. For a node that’s meant to keep running, that matches how the rest of its configuration is handled, with every setting in a root-owned file rather than in state someone could change by clicking.
Restarting Grafana
sudo systemctl restart grafana-server
Grafana reads provisioning files at startup, so the new provider takes effect with a restart. Unlike Prometheus’s reload, this restarts the whole service; Grafana’s state lives in its own database, so users, the data source, and existing dashboards come back with it.
The dashboards in Grafana
After the restart, Grafana’s Dashboards page shows the provisioned set:
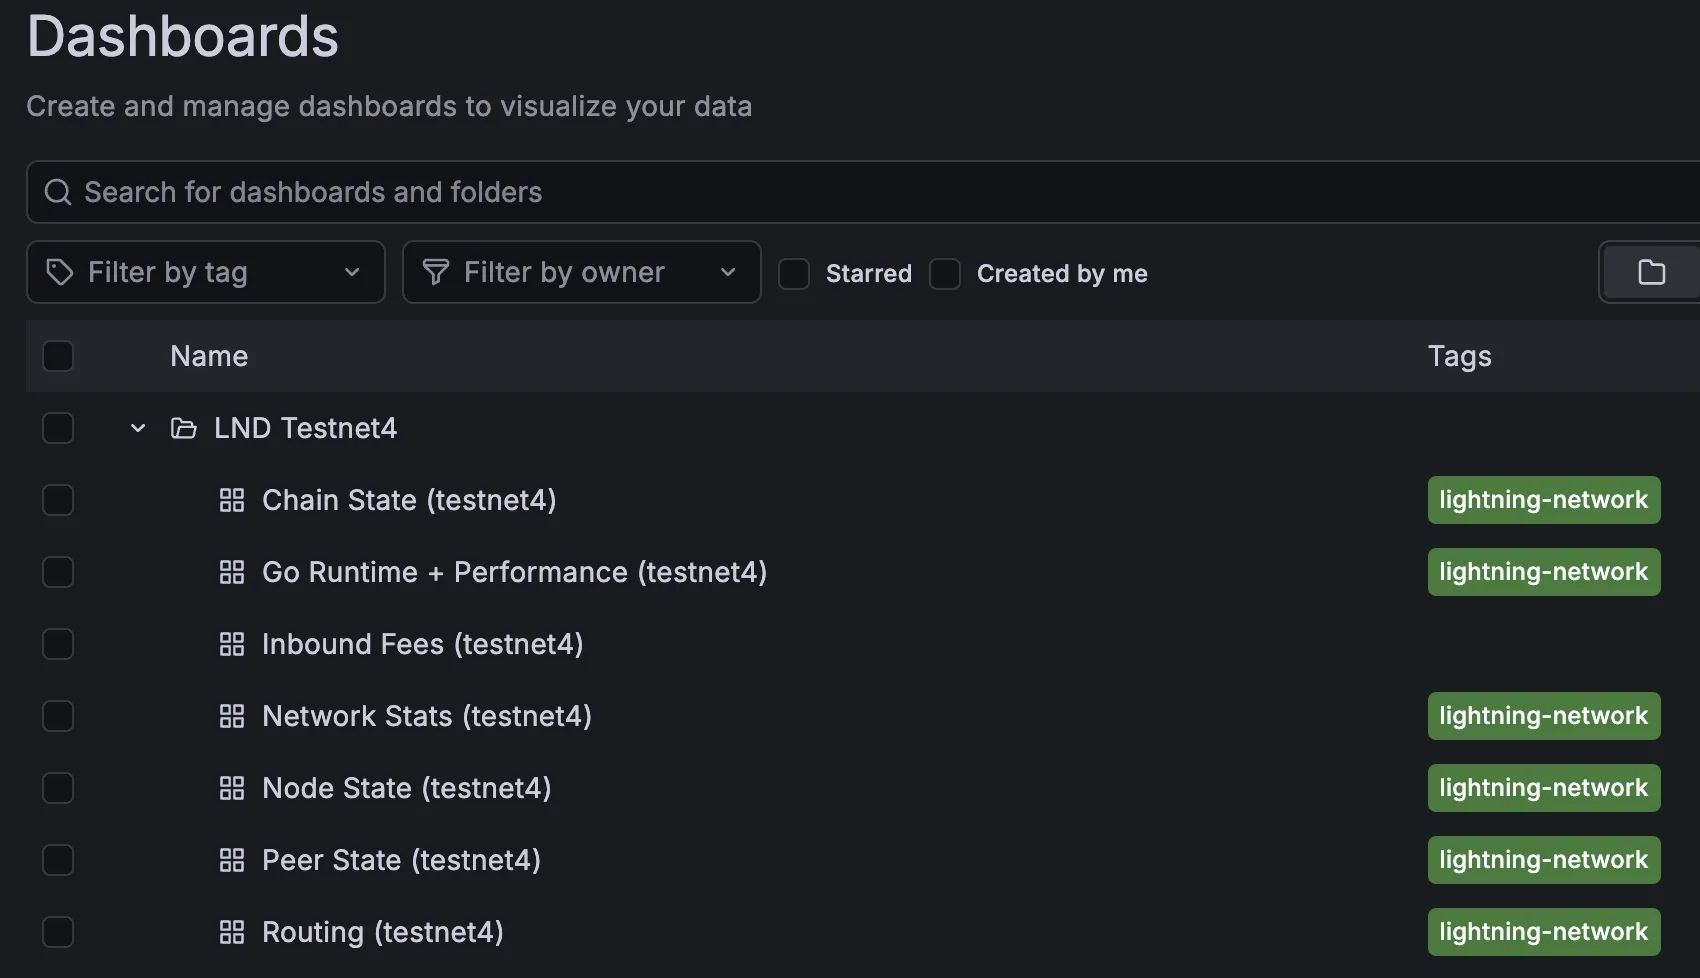
| What’s shown | Where it comes from |
|---|---|
Folder LND Testnet4 | The provider’s folder: LND Testnet4 |
Seven dashboards, each ending (testnet4) | The seven JSON files, with the titles the copy script set |
Tag lightning-network | lndmon’s own dashboard files. Inbound Fees has none, so its file simply doesn’t set one |
All seven loaded, which means the provider found the directory, Grafana could read every file as the grafana user, and none of the JSON was rejected. The folder keeps them apart from the regtest dashboard built by hand in the monitoring series.
Opening one: the wallet panels
Opening a dashboard shows two things at once: whether the old graph panels render, and what data they pick up. Three of its panels:
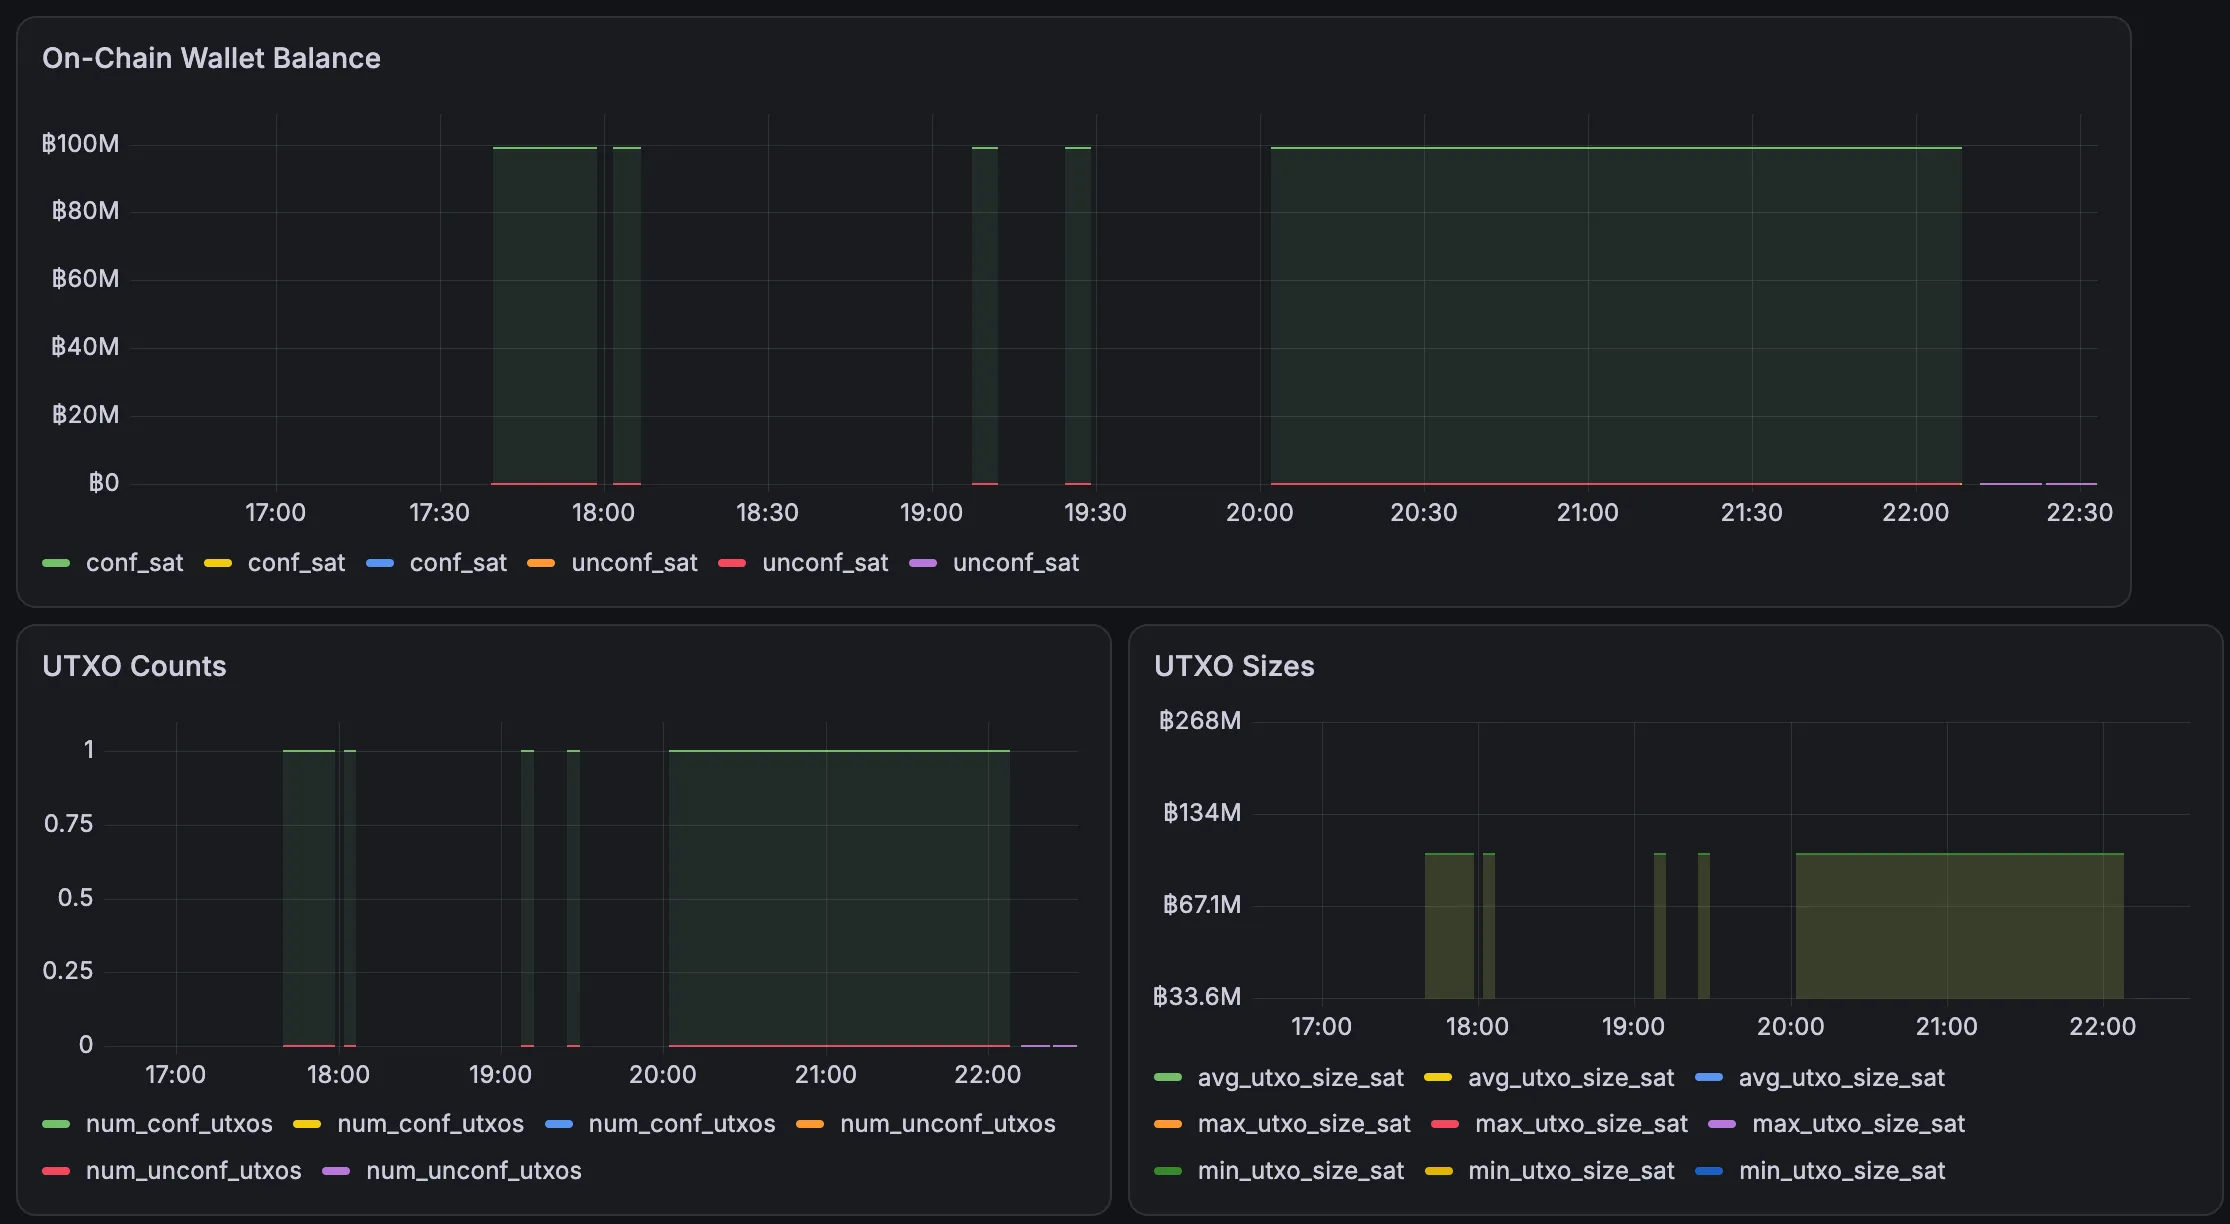
The panels render. The graph type that every lndmon dashboard uses was converted to Grafana’s current time series panel when the dashboard loaded, so the dashboards work without editing their panel types.
The data needs a closer look, though:
| What the panels show | What it is |
|---|---|
| A wallet balance of about 100M, from about 17:40 to 22:10 | Regtest node A’s on-chain wallet: the roughly 1 BTC, 100 million sat, left from the earlier series. It ends at 22:10, when the scrape job switched from the regtest exporters to testnet4 |
| A purple line at 0 from about 22:15 | The testnet4 node’s wallet. It’s new and hasn’t been funded, so 0 is correct |
Each legend name three times (conf_sat, conf_sat, conf_sat) | One series per node: regtest A, regtest B, and testnet4, with nothing in the legend to tell them apart |
| Gaps before 20:00 | The same setup gaps as in the monitoring series, when nothing was being scraped |
So the dashboards work, but they’re showing every node Prometheus has ever recorded under job="lndmon", regtest history included. The copy script pointed them at the right data source; it didn’t narrow their queries to the testnet4 node. That’s exactly the case the network label was added for: adding network="testnet4" to the dashboards’ queries would leave only the testnet4 series. The next section does that.
One display detail is misleading too. The axis reads ฿100M for what is 100 million sat, about 1 BTC: the panel labels satoshi values with a bitcoin sign. The number is right; the unit symbol isn’t.
Narrowing the dashboards to testnet4
A closer look at the dashboards explained the mixed lines. lndmon’s dashboards were written for its Kubernetes deployment: their template variables and queries filter on namespace and pod labels, which exist when Prometheus scrapes pods in a cluster. My scrape configuration doesn’t produce those labels, so the filters matched everything, and every node Prometheus had ever recorded under job="lndmon" showed up together. It’s the same assumption as the http://prometheus:9090 in datasource.yaml: these files expect the environment lndmon ships for, not a VM with plain systemd services.
After filtering on the labels this setup does have, the wallet panel shows the testnet4 node alone:
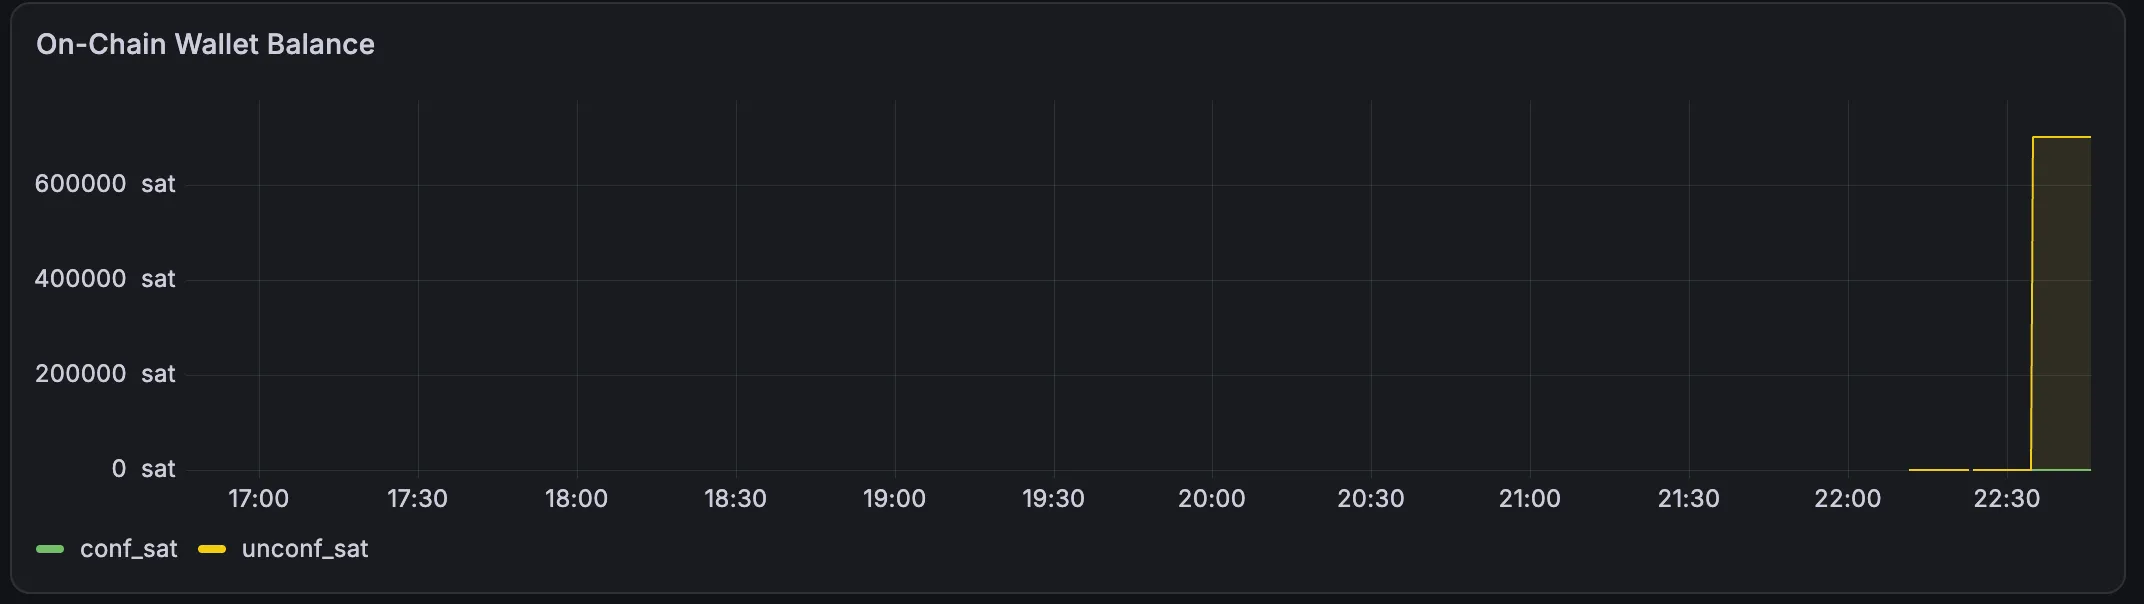
| Before | After |
|---|---|
conf_sat and unconf_sat three times each, one per node | Each once: only the testnet4 node |
| Regtest node A’s 100M sat filling the afternoon | Nothing before about 22:15, when the testnet4 exporter was first scraped |
Axis labeled ฿100M for satoshis | Axis labeled in sat |
What’s left is the testnet4 wallet’s own short history: empty from the first scrape, then a step in unconf_sat to about 700,000 at about 22:33. That step is the faucet’s 702,158 sat arriving unconfirmed, the deposit covered in the next part, seen on the dashboard at the moment it happened. conf_sat stays at 0 until a block confirms it.
Where this part ends
The monitoring stack now follows the testnet4 node:
| Piece | Testnet4 setup |
|---|---|
| lndmon | lndmon-testnet4.service, as lnd-t4, metrics on 127.0.0.1:9094, enabled |
| Prometheus | The lndmon job scrapes 9094, with network: testnet4 and node: t4 labels; the regtest targets are commented out |
| Grafana | lndmon’s seven dashboards, adjusted to the existing data source, narrowed to the testnet4 node, and provisioned read-only into the LND Testnet4 folder |
What’s left is letting the node finish its initial sync, so the panels show a node that’s caught up rather than one that’s still replaying 2024.