In the previous post, lndmon exposed LND’s state on a /metrics endpoint. This post moves one step further: the Prometheus UI, and where its alerts actually come from.
The Prometheus UI
Prometheus ships with a small web UI. Two parts of it are enough for most of this lab.
Query lets you search the stored metrics with PromQL, Prometheus’s query language, and draw them as a table or graph. For example, the number of successful L402 invoices over the last 15 minutes:
sum(increase(aperture_l402_mint_total{result="ok"}[15m]))![Prometheus Query page graphing sum(increase(aperture_l402_mint_total{result="ok"}[15m])) over 30 minutes: flat around 30, then stepping down after 03:05](/_astro/mint-ok-15m-window.BvS45IPY_Zo4rFj.webp)
A PromQL query on the Query page. This one comes from the incident drill, where the pricer died at 03:05 and successful invoices drained out of the 15-minute window.
Alerts in the navigation bar lists every alert rule Prometheus has loaded and its current state: inactive, pending, or firing.
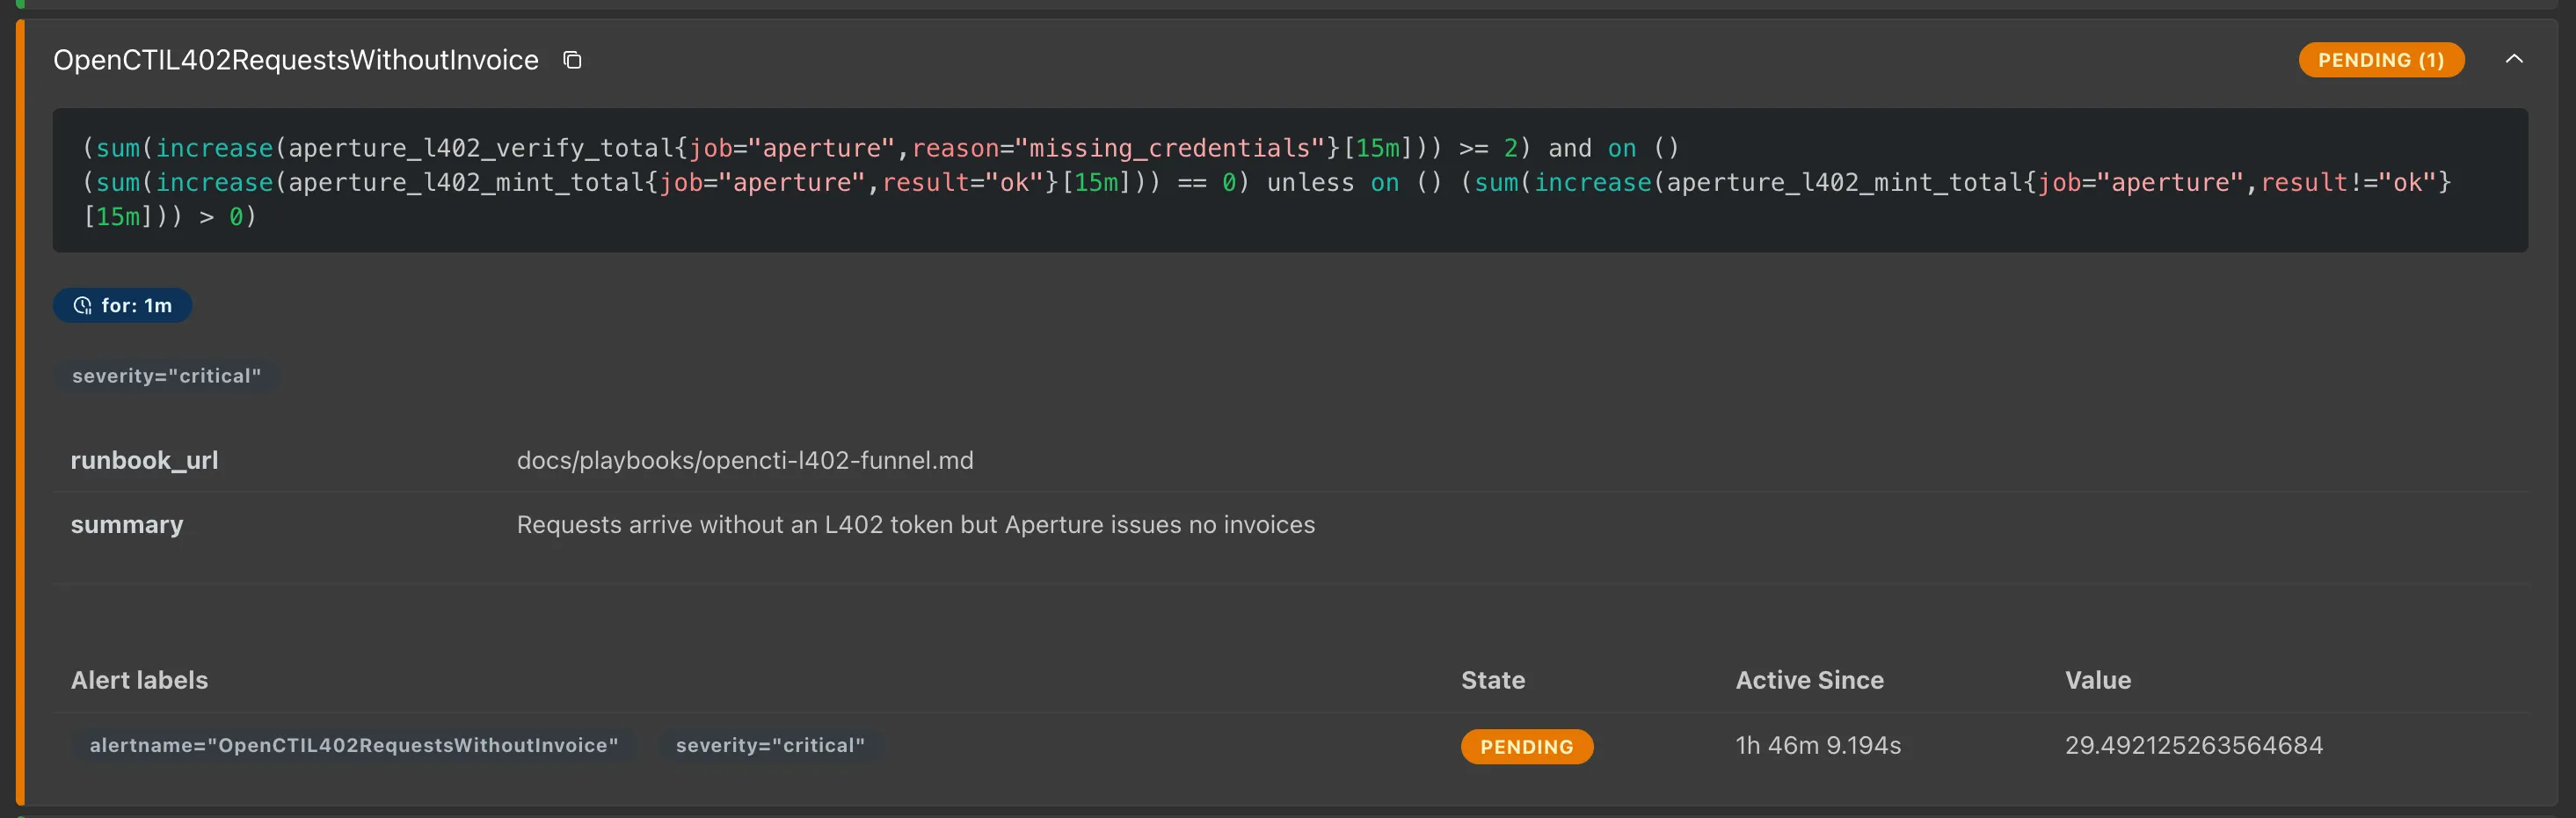
One rule on the Alerts page: its expression, how long it must stay true (for: 1m), its labels, and its current state.
So where do those rules come from?
Option 1: rules in the Helm values
I installed Prometheus with the kube-prometheus-stack Helm chart. The chart’s values.yaml has a key, additionalPrometheusRulesMap, where you can write your own rules next to the rest of the configuration.
Here is a minimal lab: the chart’s default rules and the extra components are switched off, and one alert is added that is always true.
cd ~/prometheus-alert-lab

cat > alert-test-values.yaml <<'EOF'
defaultRules:
  create: false

grafana:
  enabled: false

alertmanager:
  enabled: false

nodeExporter:
  enabled: false

kubeStateMetrics:
  enabled: false

additionalPrometheusRulesMap:
  manual-test:
    groups:
      - name: manual-test
        rules:
          - alert: ManualAlertTest
            expr: vector(1)
            for: 1m
            labels:
              severity: warning
            annotations:
              summary: "Manual alert test"
              description: "A test alert: its condition is always true and has held for one minute."
EOF
Starting from the chart’s default values.yaml, you can define your own rules for your applications the same way.
Then install or upgrade the release with that file:
helm upgrade --install alert-lab ./kube-prometheus-stack \
  --namespace monitoring-lab \
  --create-namespace \
  -f alert-test-values.yaml \
  --wait --timeout 10m
About a minute after the rule loads, ManualAlertTest moves from pending to firing on the Alerts page.
Option 2: a PrometheusRule file per service
The Helm route works, but it ties every alert change to a helm upgrade of the whole monitoring stack.
kube-prometheus-stack runs the Prometheus Operator, which watches for PrometheusRule resources in the cluster and loads them into Prometheus. So a rule can also be its own Kubernetes object, applied with kubectl:
apiVersion: monitoring.coreos.com/v1
kind: PrometheusRule
metadata:
  name: test-alerts
  namespace: monitoring-lab
  labels:
    release: alert-lab   # must match the Prometheus ruleSelector
spec:
  groups:
    - name: manual-test
      rules:
        - alert: ManualAlertTest
          expr: vector(1)
          for: 1m
          labels:
            severity: warning
          annotations:
            summary: "Manual alert test"
kubectl apply -f rules/test-alerts.yamlThe release label matters. By default, kube-prometheus-stack configures Prometheus to load only the rules whose labels match its ruleSelector, which is the Helm release name. A rule without that label is accepted by Kubernetes but never loaded.
The split I use
The practice I settled on is to keep each concern in one place:
- The Prometheus installation (version, memory, storage, retention) lives in Helm values.
- Each service’s alerts live in their own
PrometheusRulefile.
monitoring/
├── values.yaml              # Prometheus install, storage, retention
└── rules/
    ├── lnd-alerts.yaml      # LND channel and sync alerts
    ├── app-alerts.yaml      # application errors and latency
└── test-alerts.yaml # lab-only alerts| What changes | File to edit | How it is applied |
|---|---|---|
| Prometheus version, memory, storage | values.yaml | helm upgrade |
| Add an LND alert or change a threshold | rules/lnd-alerts.yaml | kubectl apply -f |
| Add an application alert | rules/app-alerts.yaml | kubectl apply -f |
With this split, editing one alert never touches the Prometheus installation settings.
Rules for managing the rules
- Don’t edit the downloaded chart’s templates. Every chart upgrade would then mean merging your changes back in by hand. Customize through values instead.
- Give each rule exactly one home. Don’t define the same rule in both the Helm values and a separate YAML file.
- Keep rule files in Git. Then you can see who changed a threshold, why, and roll it back.
- Match the namespace and labels. Prometheus only loads rules selected by its
ruleSelectorandruleNamespaceSelector. See the Prometheus Operator guide on deploying rules. - Check the Rules page after applying. Loading and evaluation errors show up there. For important rules,
promtoolcan also test when an alert should fire and resolve; see unit testing for rules.
For a small lab, putting everything in additionalPrometheusRulesMap is fine. Here I practiced adding separate PrometheusRule files by hand; the next step is letting Flux apply those files from Git automatically.