Part 2 of the series. Part 1 built lndmon and left one exporter per node running under systemd: node A on 127.0.0.1:9092, node B on 127.0.0.1:9093.
Installing Prometheus
Checking what apt offers
Unlike Bitcoin Core, LND, and lndmon, Prometheus is packaged in Ubuntu. Before installing, apt-cache policy shows which version the package would bring:
apt-cache policy prometheus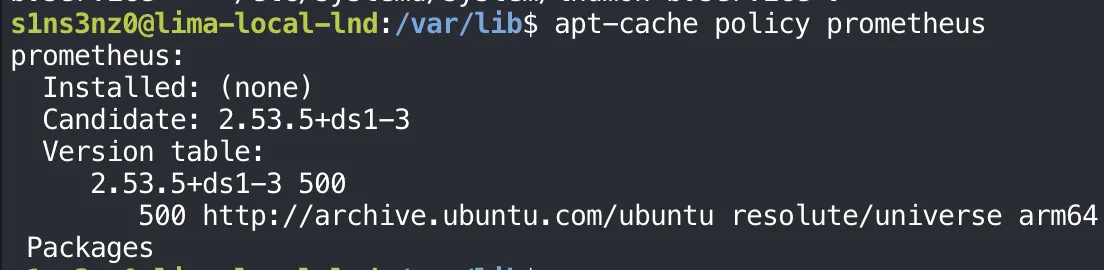
| Line | Meaning |
|---|---|
Installed: (none) | Not installed yet |
Candidate: 2.53.5+ds1-3 | The version apt install would pick: Prometheus 2.53.5, repackaged for Debian and Ubuntu (+ds1), package revision 3 |
500 http://archive.ubuntu.com/ubuntu resolute/universe arm64 | Where it comes from: Ubuntu 26.04’s (resolute) universe component, built for arm64. 500 is the default priority |
Two things follow from that. First, a package from Ubuntu’s archive arrives already verified: apt checks the archive’s signature on every download, which replaces the checksum and signature steps the previous series did by hand for Bitcoin Core and LND. Second, universe is the community-maintained part of Ubuntu, and the packaged version is from the Prometheus 2.53 line, not the newest upstream release. For a lab that needs Prometheus to scrape two endpoints and answer queries, that’s enough, and it keeps updates in apt’s hands.
The unit the package ships
The package doesn’t just install a binary. It also creates a prometheus system user and a systemd unit, the two things the previous series wrote by hand for bitcoind and lnd. systemctl cat shows the unit:
systemctl cat prometheus![systemctl cat prometheus shows /usr/lib/systemd/system/prometheus.service: [Unit] Description=Monitoring system and time series database, Documentation, After=time-sync.target; [Service] Restart=on-abnormal, User=prometheus, EnvironmentFile=/etc/default/prometheus, ExecStart=/usr/bin/prometheus $ARGS, ExecReload=/bin/kill -HUP $MAINPID, TimeoutStopSec=20s, SendSIGKILL=no; a "systemd hardening-options" block with AmbientCapabilities=, CapabilityBoundingSet=, DeviceAllow=/dev/null rw, DevicePolicy=strict, LimitMEMLOCK=0, LockPersonality=true, MemoryDenyWriteExecute=true, NoNewPrivileges=true, PrivateDevices=true, PrivateTmp=true, PrivateUsers=true, ProtectControlGroups=true, ProtectHome=true, ProtectKernelModules=true, ProtectKernelTunables=true, ProtectSystem=full, RemoveIPC=true, RestrictNamespaces=true, RestrictRealtime=true, SystemCallArchitectures=native; [Install] WantedBy=multi-user.target](/_astro/prometheus-unit.Cgj5ucga_3m5Eb.webp)
The file lives in /usr/lib/systemd/system/, where packages put their units, not /etc/systemd/system/ like mine. That matters for changes: editing it directly would be overwritten by the next package update, so local changes go in a drop-in under /etc/systemd/system/prometheus.service.d/, through sudo systemctl edit prometheus.
The service settings:
| Directive | Meaning |
|---|---|
After=time-sync.target | Start after the clock is synchronized. A time-series database stamps every sample with the current time, so a wrong clock means wrong data |
Restart=on-abnormal | Restart after a crash, a signal, or a timeout, but not after a clean exit with an error code. Narrower than on-failure in my units |
User=prometheus | The account the package created |
EnvironmentFile=/etc/default/prometheus, ExecStart=/usr/bin/prometheus $ARGS | Command-line flags live in /etc/default/prometheus as ARGS, so they can change without touching the unit |
ExecReload=/bin/kill -HUP $MAINPID | systemctl reload prometheus sends SIGHUP, which makes Prometheus re-read its configuration without restarting. Adding scrape targets won’t need a restart |
TimeoutStopSec=20s, SendSIGKILL=no | Give it 20 seconds to stop, and never force-kill it, so it always gets to finish writing its data to disk |
Then a whole block marked # systemd hardening-options. My units had four hardening lines; this one has twenty:
| Directive | What it takes away |
|---|---|
CapabilityBoundingSet=, AmbientCapabilities= (empty) | Every Linux capability. The process can’t hold any root-like privilege, even partly |
NoNewPrivileges=true | Gaining privileges later, for example through a setuid binary |
DevicePolicy=strict, DeviceAllow=/dev/null rw, PrivateDevices=true | Access to devices, except /dev/null and a private, minimal /dev |
PrivateTmp=true | The shared /tmp. It gets its own |
PrivateUsers=true | The real user table. It runs in its own user namespace |
ProtectSystem=full, ProtectHome=true | Write access to /usr, /boot, /efi, /etc, and any access to home directories |
ProtectKernelModules=true, ProtectKernelTunables=true, ProtectControlGroups=true | Loading kernel modules, changing kernel settings under /proc/sys and /sys, and changing cgroups |
MemoryDenyWriteExecute=true | Memory that is both writable and executable, which injected code would need |
LockPersonality=true, SystemCallArchitectures=native | Switching to another execution personality or system-call ABI, a way around other filters |
RestrictNamespaces=true, RestrictRealtime=true | Creating new namespaces, and realtime scheduling that could starve the rest of the system |
LimitMEMLOCK=0, RemoveIPC=true | Locking memory, and leftover shared-memory objects after it stops |
Prometheus only needs to make HTTP requests, write its database, and serve queries, so the package can afford to take away everything else. The same list is a useful checklist for tightening my own bitcoind, lnd, and lndmon units later.
The flags file
The unit takes its command-line flags from /etc/default/prometheus:
cat /etc/default/prometheus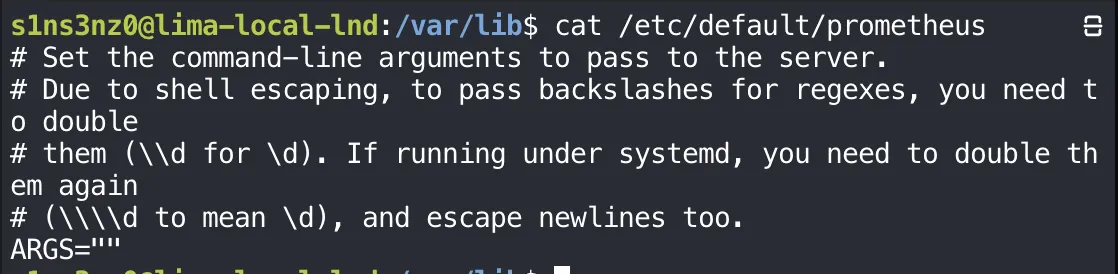
ARGS="" is empty, so Prometheus runs with its defaults. The comments warn about escaping: the value passes through the shell and then systemd, so a regex backslash has to be written four times. With no flags set, the configuration file, the data directory, and the listen address all come from defaults, and --help shows what they are:
prometheus --help 2>&1 | rg -A 2 -- '--config.file|--storage.tsdb.path|--web.listen-address'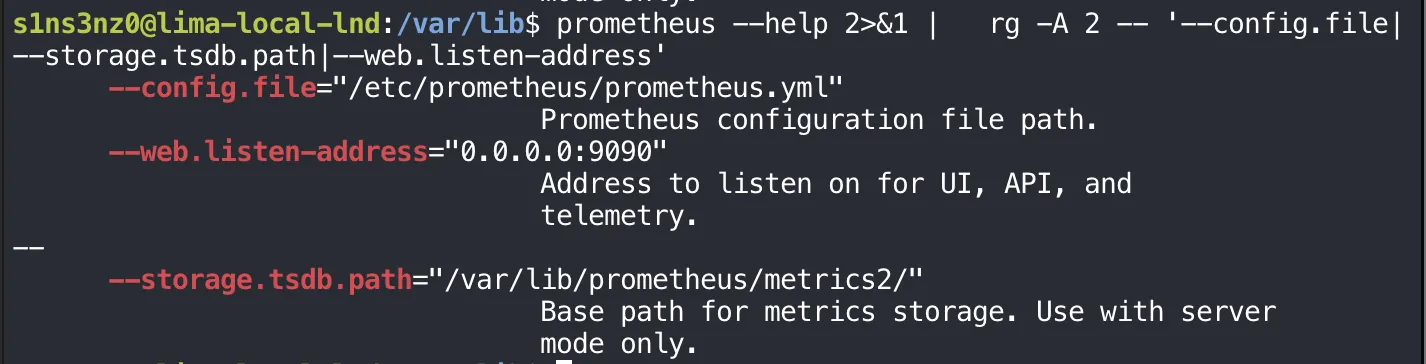
2>&1 is there because --help prints to standard error; it sends that into the pipe. rg -A 2 shows each matching flag plus the two lines after it, and -- tells rg the pattern that follows isn’t one of its own options, since it starts with dashes.
| Flag | Default | Meaning |
|---|---|---|
--config.file | /etc/prometheus/prometheus.yml | Where the scrape targets will be configured |
--storage.tsdb.path | /var/lib/prometheus/metrics2/ | Where the time series are stored, under /var/lib like the nodes’ data |
--web.listen-address | 0.0.0.0:9090 | The web interface, API, and Prometheus’s own metrics |
The first two fit the lab as they are. The third doesn’t. 0.0.0.0 means every interface, so Prometheus’s API would be reachable from outside the VM, unlike everything else here, which binds to 127.0.0.1. Keeping the same rule means setting the address explicitly:
ARGS="--web.listen-address=127.0.0.1:9090"After setting ARGS and restarting Prometheus (a listen address is read only at startup, so reload isn’t enough), ss shows where it actually listens:
sudo ss -lntp '( sport = :9090 )'
Prometheus listens on 127.0.0.1:9090 only, the same as every other service in the lab. The 0.0.0.0:* under “Peer Address” isn’t the listen address; it means any peer may connect, which on a loopback socket means only programs inside the VM.
The sample configuration
The scrape targets go in /etc/prometheus/prometheus.yml. The package ships a sample:
cat /etc/prometheus/prometheus.yml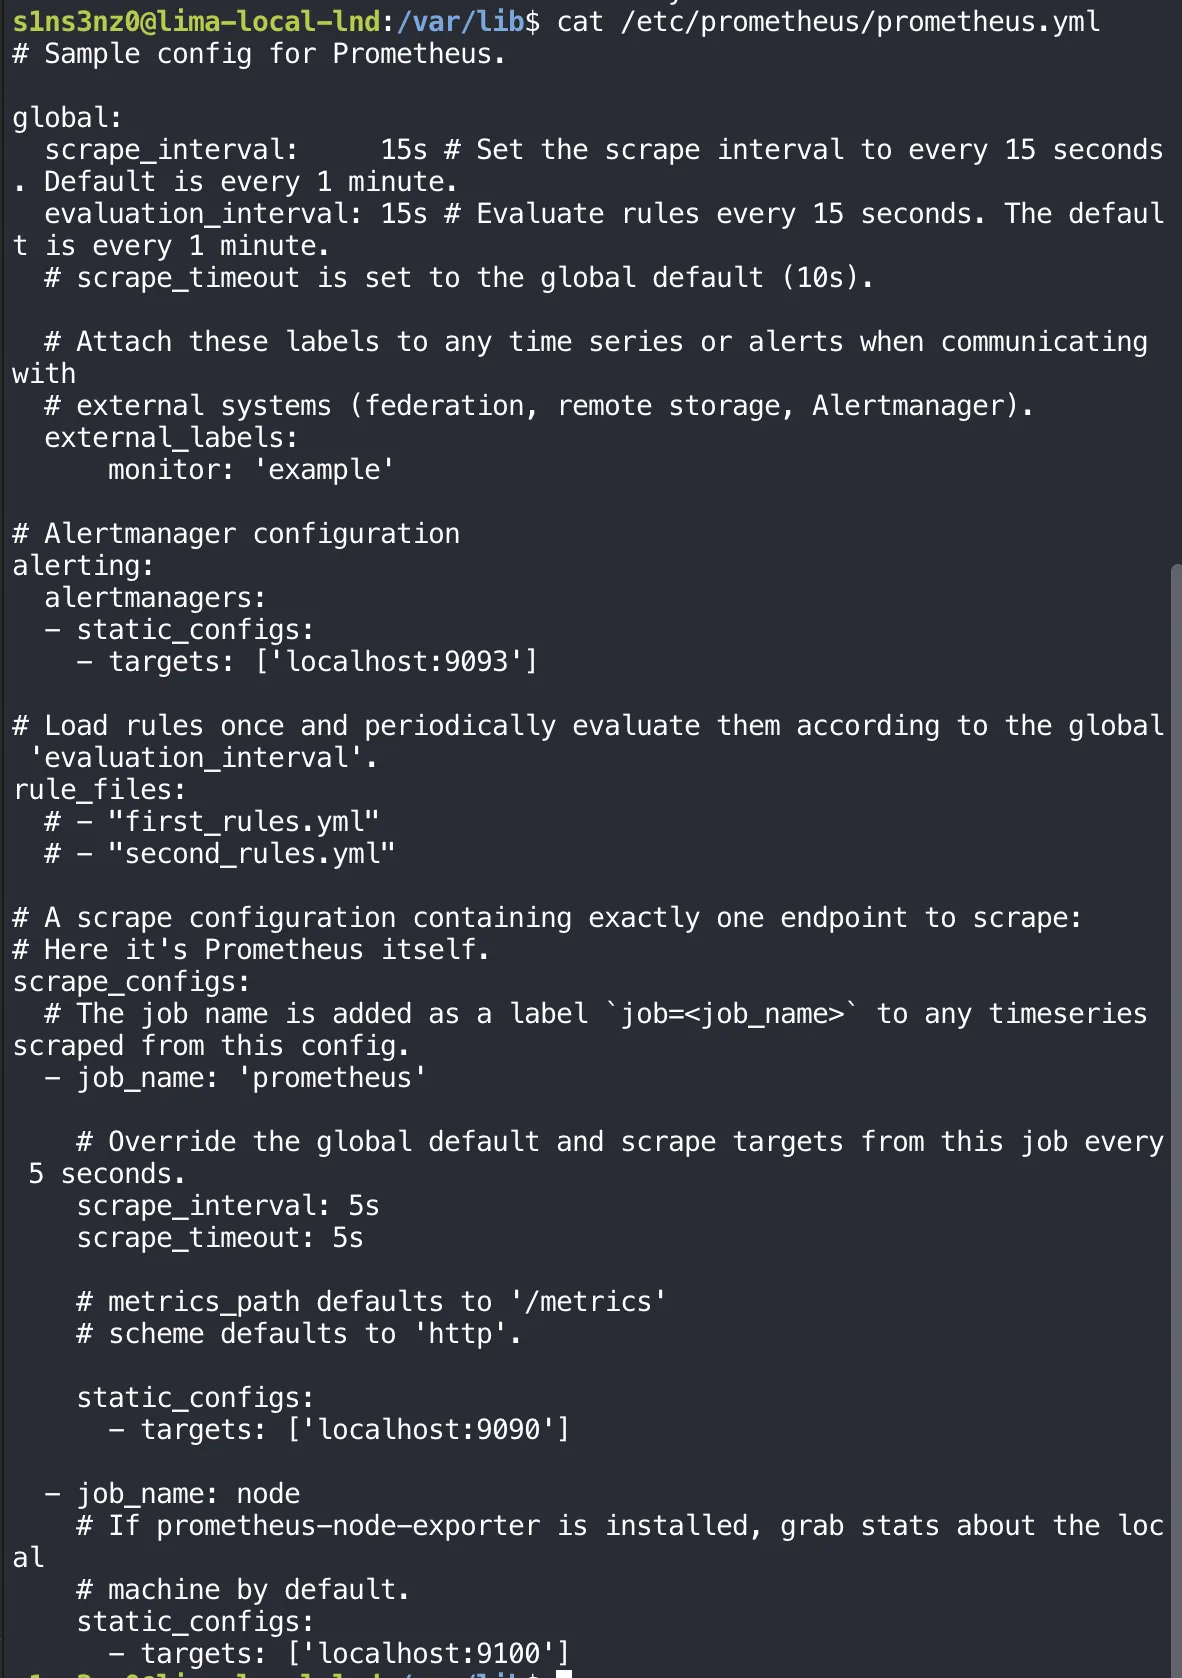
| Section | Sample value | Meaning |
|---|---|---|
global.scrape_interval | 15s | How often each target is scraped, unless a job overrides it |
global.evaluation_interval | 15s | How often alerting and recording rules are evaluated |
external_labels | monitor: 'example' | A label added when this Prometheus talks to other systems, such as Alertmanager |
alerting.alertmanagers | localhost:9093 | Where alerts would be sent |
rule_files | Commented out | No alert rules yet |
Job prometheus | localhost:9090, every 5s | Prometheus scraping its own metrics |
Job node | localhost:9100 | The host’s metrics, if prometheus-node-exporter is running |
Each job_name becomes a job label on every series that job scrapes, which is how queries tell one kind of target from another.
Two lines in the sample collide with this lab:
localhost:9093underalertmanagers. 9093 is Alertmanager’s usual port, but in this VM it’s wherelndmon-bserves node B’s metrics. Left as is, Prometheus would try to deliver alerts to lndmon. There are no alert rules yet, so nothing is sent. For now I’m removing thealertingblock entirely, and Alertmanager will get its own port when the alerting part of this series adds it.localhost:9100for thenodejob. It only works ifprometheus-node-exporteris installed and running. Otherwise the target shows as down, which is noise on a page that should show failures clearly.
So the plan for the configuration: keep the prometheus and node jobs, add the two lndmon exporters, A on 9092 and B on 9093, and drop the alerting block.
Backing up the original
Before editing, a copy of the package’s file:
sudo cp -a /etc/prometheus/prometheus.yml /etc/prometheus/prometheus.yml.bak-a (archive) copies the file’s attributes along with its contents: owner, group, mode, and timestamps. A plain sudo cp would leave the copy owned by root with default permissions, so restoring it later could quietly change who can read the configuration. With -a, putting the backup back restores the file exactly as the package installed it.
The new configuration
I replaced the sample with a shorter file of my own:
sudo tee /etc/prometheus/prometheus.yml >/dev/null <<'EOF'
global:
  scrape_interval: 15s
  evaluation_interval: 15s

scrape_configs:
  - job_name: prometheus
    static_configs:
      - targets: ['127.0.0.1:9090']

  - job_name: node
    static_configs:
      - targets: ['127.0.0.1:9100']

  - job_name: lndmon
    static_configs:
      - targets: ['127.0.0.1:9092']
        labels:
          node: a
      - targets: ['127.0.0.1:9093']
        labels:
          node: b
EOF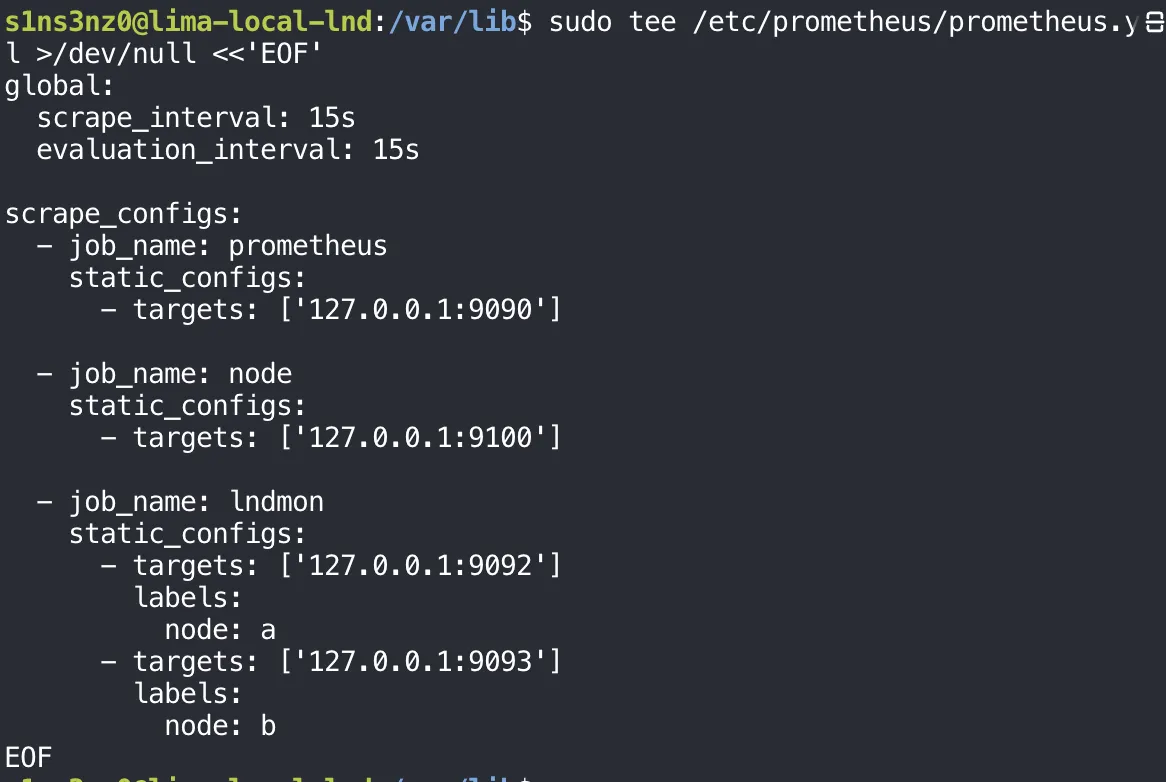
| Part | Meaning |
|---|---|
global | Scrape every target and evaluate rules every 15 seconds, as in the sample |
Job prometheus | Prometheus’s own metrics. Every job now uses the global 15s; the sample’s 5s override is gone |
Job node | The VM’s host metrics on 9100, unchanged from the sample |
Job lndmon | Both exporters in one job, as two target groups |
labels: node: a / node: b | An extra label on every series from that target |
Both exporters serve the same kind of metrics, so they share one job, lndmon, and a node label tells them apart. Every series from 9092 carries job="lndmon", node="a", and every series from 9093 job="lndmon", node="b". A dashboard panel can then show lnd_peer_count once per node with a single query, instead of one query per job.
Compared with the sample, localhost became 127.0.0.1, matching every other address in this lab, and three sections are gone: alerting, because of the 9093 collision; rule_files, since there are no rules yet; and external_labels, which only matters when talking to other systems. They come back when the alerting part needs them.
Checking it before Prometheus reads it
The package also installs promtool, Prometheus’s own checker. It plays the part systemd-analyze verify played for unit files:
promtool check config /etc/prometheus/prometheus.yml
SUCCESS means the YAML parses and every key is one Prometheus knows, with valid values. That’s worth checking first because a reload with a broken file doesn’t take Prometheus down; it keeps running on the old configuration and logs the error, which is easy to miss. promtool checks syntax and structure, not whether the targets are reachable. That’s what the targets page shows after the reload.
Reloading and checking the targets
The unit’s ExecReload sends SIGHUP, so the new targets take effect without restarting Prometheus. Then I asked Prometheus itself whether it can reach both exporters, through its query API:
sudo systemctl reload prometheus
curl -fsSG http://127.0.0.1:9090/api/v1/query \
  --data-urlencode 'query=up{job="lndmon"}' |
python3 -m json.tool![sudo systemctl reload prometheus; curl -fsSG http://127.0.0.1:9090/api/v1/query --data-urlencode 'query=up{job="lndmon"}' piped into python3 -m json.tool returns status success, resultType vector, two results: up with instance 127.0.0.1:9093, job lndmon, node b, value [1790930369.656, "1"]; and up with instance 127.0.0.1:9092, job lndmon, node a, value [1790930369.656, "1"]](/_astro/prometheus-up-query.CvlyiJAn_1wcvEk.webp)
| Part | Meaning |
|---|---|
-G with --data-urlencode | Send the query as a URL parameter on a GET request, encoding the braces and quotes safely |
up{job="lndmon"} | up is a series Prometheus records for every target on every scrape: 1 if the scrape worked, 0 if it didn’t. The selector keeps the lndmon job |
python3 -m json.tool | Pretty-print the JSON answer, with Python’s standard library, nothing extra to install |
The answer has one result per exporter:
instance | node | up |
|---|---|---|
127.0.0.1:9092 | a | 1 |
127.0.0.1:9093 | b | 1 |
Both exporters are being scraped, and each series carries the job and node labels from the configuration, plus instance, the address Prometheus scraped. The first number in value is the time of the sample as a Unix timestamp; the second is the value itself, as a string, which is how the API returns numbers.
up needs reading carefully, though. It says whether Prometheus could scrape lndmon, not whether LND is healthy: an exporter can answer while the node behind it is down. When node B is stopped later in this series, comparing up{node="b"} with B’s LND metrics will show which one notices first.
The same query for the other two jobs:
curl -fsSG http://127.0.0.1:9090/api/v1/query \
  --data-urlencode 'query=up{job="node"}' |
  python3 -m json.tool
curl -fsSG http://127.0.0.1:9090/api/v1/query \
  --data-urlencode 'query=up{job="prometheus"}' |
  python3 -m json.tool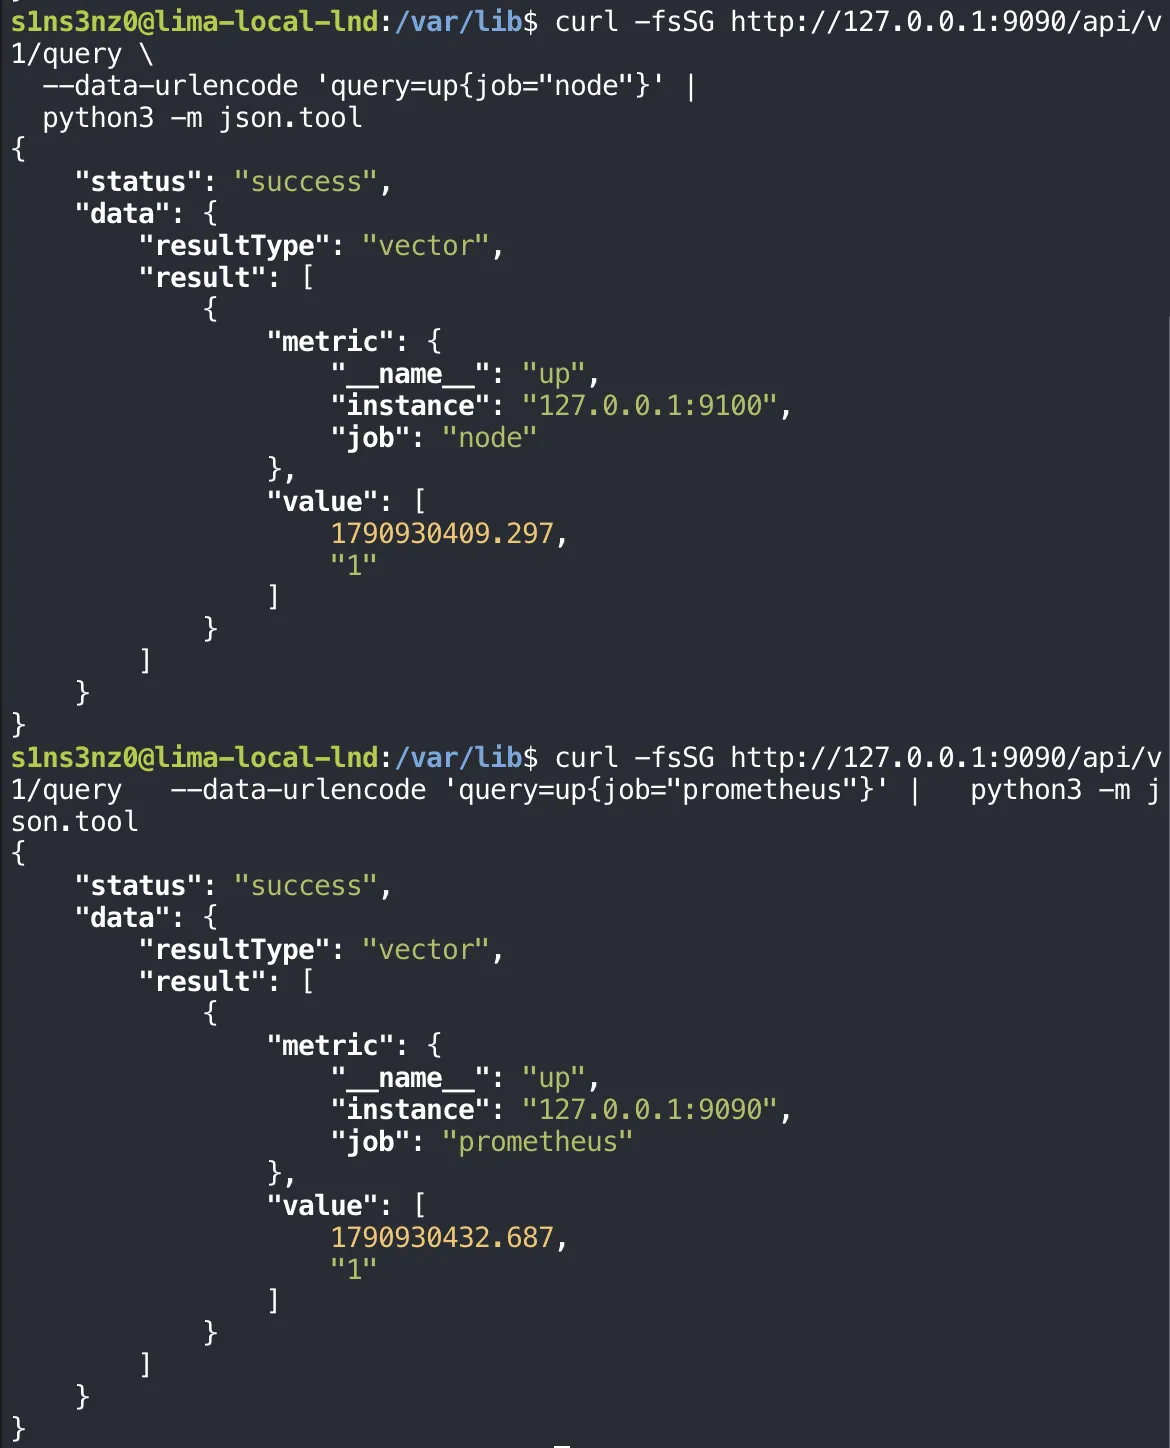
| Job | instance | up |
|---|---|---|
node | 127.0.0.1:9100 | 1 |
prometheus | 127.0.0.1:9090 | 1 |
The node target is up, so the worry from the sample configuration didn’t apply: prometheus-node-exporter is running and serving the VM’s own metrics on 9100. Prometheus is scraping itself too. All four targets, the two lndmon exporters, the host, and Prometheus itself, report up as 1. Only the lndmon results carry a node label, since only those targets were given one.
Where this part ends
Prometheus is collecting from four targets every 15 seconds: both lndmon exporters, labeled node="a" and node="b", the VM’s own metrics through node exporter, and itself. Everything listens on loopback only. The data is there; what’s missing is a view of it, which is Grafana, next.
Next: Dashboards with Grafana.