This is the lab behind my Lineth L2 postmortem series. It exists for one reason: to run a real system long enough for real things to break, and to practise operating it the way an SRE team would: GitOps, SLOs, alerts that reach a person, runbooks, and postmortems.
The system is a complete Ethereum layer-2 rollup (sequencer, prover, bridge relayer, the L1 contracts it settles on), on top of its own proof-of-stake L1, all on one laptop. This post covers two things: how it is laid out on Kubernetes, and how it is monitored. Every dashboard screenshot below was taken from the running lab on 2026-10-14, over the last 12 hours.
1. Architecture
The host
| Machine | MacBook Pro, Apple M4 Pro, 48 GB |
| Runtime | Docker Desktop, VM sized to 30 GiB / 14 CPUs (36 GiB starved the Mac: see Part 2) |
| Cluster | kind lineth-local: one control-plane node, Kubernetes v1.37, containerd, arm64 |
| Storage | local-path provisioner plus hostPath volumes under /srv/lineth |
| Workloads | ~70 pods in 11 namespaces |
One node is a deliberate constraint. There is no redundancy to hide behind: a node memory stall, a Docker restart or a DNS race shows up as a user-visible failure, which is exactly what I want to practise on.
Two chains on one node
flowchart LR
    subgraph L1["local-l1 (PoS L1, 1 s slots)"]
        B1[Besu EL] <-->|Engine API| T1[Teku beacon]
        TV[Teku validator] --> T1
        TV --> W1[Web3Signer + Postgres]
        CE[chain-exporter]
    end
    subgraph L2["lineth-l2 (zk-rollup)"]
        SEQ[Sequencer<br/>Besu] <--> MARU[Maru<br/>L2 consensus]
        RPC[l2-node-besu<br/>public RPC] <-->|P2P| SEQ
        SH[Shomei<br/>state manager]
        COORD[Coordinator] --> PROV[Prover]
        COORD --> W2[Web3Signer]
        PM[Postman<br/>bridge relayer]
        TEA[tx-exclusion API]
        BS[Blockscout]
        GEN[Traffic generators]
    end
    V[(Vault)] -.keys.-> W2
    GEN --> RPC
    COORD -->|blobs, proofs| B1
    PM <-->|claims| B1
    PM <-->|claims| RPC
L1 (local-l1). A minimal Ethereum proof-of-stake chain: one Besu execution client, one Teku beacon node, one Teku validator client with four validators whose keys live in Web3Signer (Postgres-backed slashing protection). Slots are 1 second. It is as small as an Ethereum chain can be, which is also why it can deadlock (Part 5).
L2 (lineth-l2). A zk-rollup built from the upstream monorepo’s components:
| component | role |
|---|---|
| sequencer (Besu) + Maru | builds L2 blocks; Maru is the L2 consensus layer |
| l2-node-besu | the public RPC node; users and services send transactions here, it gossips them to the sequencer |
| Shomei | keeps the state trie the prover needs |
| coordinator (+ Postgres) | cuts blocks into batches, requests proofs, submits blobs and finalization to L1 |
| prover | generates proofs per batch (execution, compression, aggregation) |
| Web3Signer + Vault | signs the coordinator’s L1 transactions; keys come from Vault, not the pod |
| postman (+ Postgres) | the bridge relayer: claims L1→L2 deposits and L2→L1 withdrawals |
| transaction-exclusion-api | records transactions the sequencer rejects |
| Blockscout | block explorer |
| l2-traffic, l2-users, l2-load | synthetic users: heartbeat, transfers, deposits, withdrawals, load |
The flow end to end: a user transaction → L2 block → batch → proof → blob on L1 → finalization on L1 → L1 proof-of-stake finality. A deposit or withdrawal adds the bridge on top.
What is real and what is not: the execution proof is a real zkEVM inner proof over each batch’s traces, and L1 runs a real BN254 PLONK pairing check on every finalization. The aggregation circuit is a dev one, because the full prover needs hundreds of GiB. Everything up to that line uses the real code paths.
GitOps: Flux layers with gates
Everything is declared in one repository (lineth-l2-gitops) and applied by Flux. The L2 is split into Flux Kustomizations that apply in dependency order:
flowchart LR
    BOOT[bootstrap<br/>genesis, secrets] --> SIGN[signing] --> EXEC[execution<br/>+ gate Job]
    EXEC --> DEP[contracts deploy Job] --> SETT[settlement] --> PROVE[proving<br/>+ gate Job]
    BOOT --> OBS[observability<br/>exporters]
dependsOn only orders Ready states, and Ready does not mean the chain works. So the important layers end in a gate Job that checks behaviour: the execution gate sends a probe transaction through RPC → P2P → sequencer and checks the state root; the settlement gate waits until a probe transaction is finalized on the L1 rollup contract. The observability layer depends only on bootstrap, so it keeps reporting while everything else is broken.
Other rules the repo follows:
- Secrets are SOPS/age-encrypted in Git; Flux decrypts them in-cluster. No plaintext keys or passwords in the repo.
- Jobs are immutable: to re-run one, bump its
-vNsuffix. - Every deviation from upstream is written down with the reason (for example, trace limits divided by 16 so the prover fits in ~8 GiB).
- Changes and incidents are recorded in
docs/changes/anddocs/incident-log.md.
2. Monitoring
The stack
| signal | tool | details |
|---|---|---|
| metrics | kube-prometheus-stack 91.8 (Prometheus, Alertmanager, Grafana 13) | 30-day retention: the SLO window is 28 days |
| logs | Grafana Alloy → Loki | Alloy tails pods through the Kubernetes API; 7 days |
| traces | Alloy (OTLP) → Tempo | workflow traces + span metrics; 7 days |
| alert routing | Alertmanager → Telegram, alert-sink, AI SRE Ops console | a Watchdog heartbeat proves the route itself works |
Logs get a normalised level label (each component logs in its own format), ANSI colours stripped, and Java stack traces joined into one entry. High-cardinality values (transaction hashes, block numbers) stay out of labels and are searched in the line.
Detection as code: a separate repository
Dashboards, alert rules, SLOs and runbooks live in their own repo, lineth-observability, deployed into the cluster by Flux from a pinned tag. The monitoring stack itself stays in the GitOps repo; what it should detect is versioned, reviewed and tested separately.
| count | |
|---|---|
| L1 alerts | 30 |
| L2 alerts | 21 |
| SLOs | 9 (28 burn-rate alerts, 93 recording rules, generated) |
| Grafana dashboards | 24 lab dashboards + the stack’s defaults |
| runbooks | one per failure mode, linked from the alerts |
CI runs promtool checks and unit tests for the alert rules, lints every dashboard, fails on metric names that do not exist in the catalogue, and checks that every alert has a runbook. The L2 dashboards and SLO rules are generated from Python, so 24 dashboards share one layout and one threshold table instead of drifting apart.
Dashboard layout: start from the overview
Every dashboard follows the same pattern: status first (scrape health, OOM history), then the health stats for that area, then history. Each panel’s description says what it measures, how to read it, when to investigate and what to check next. Buttons along the top link to the related dashboards.
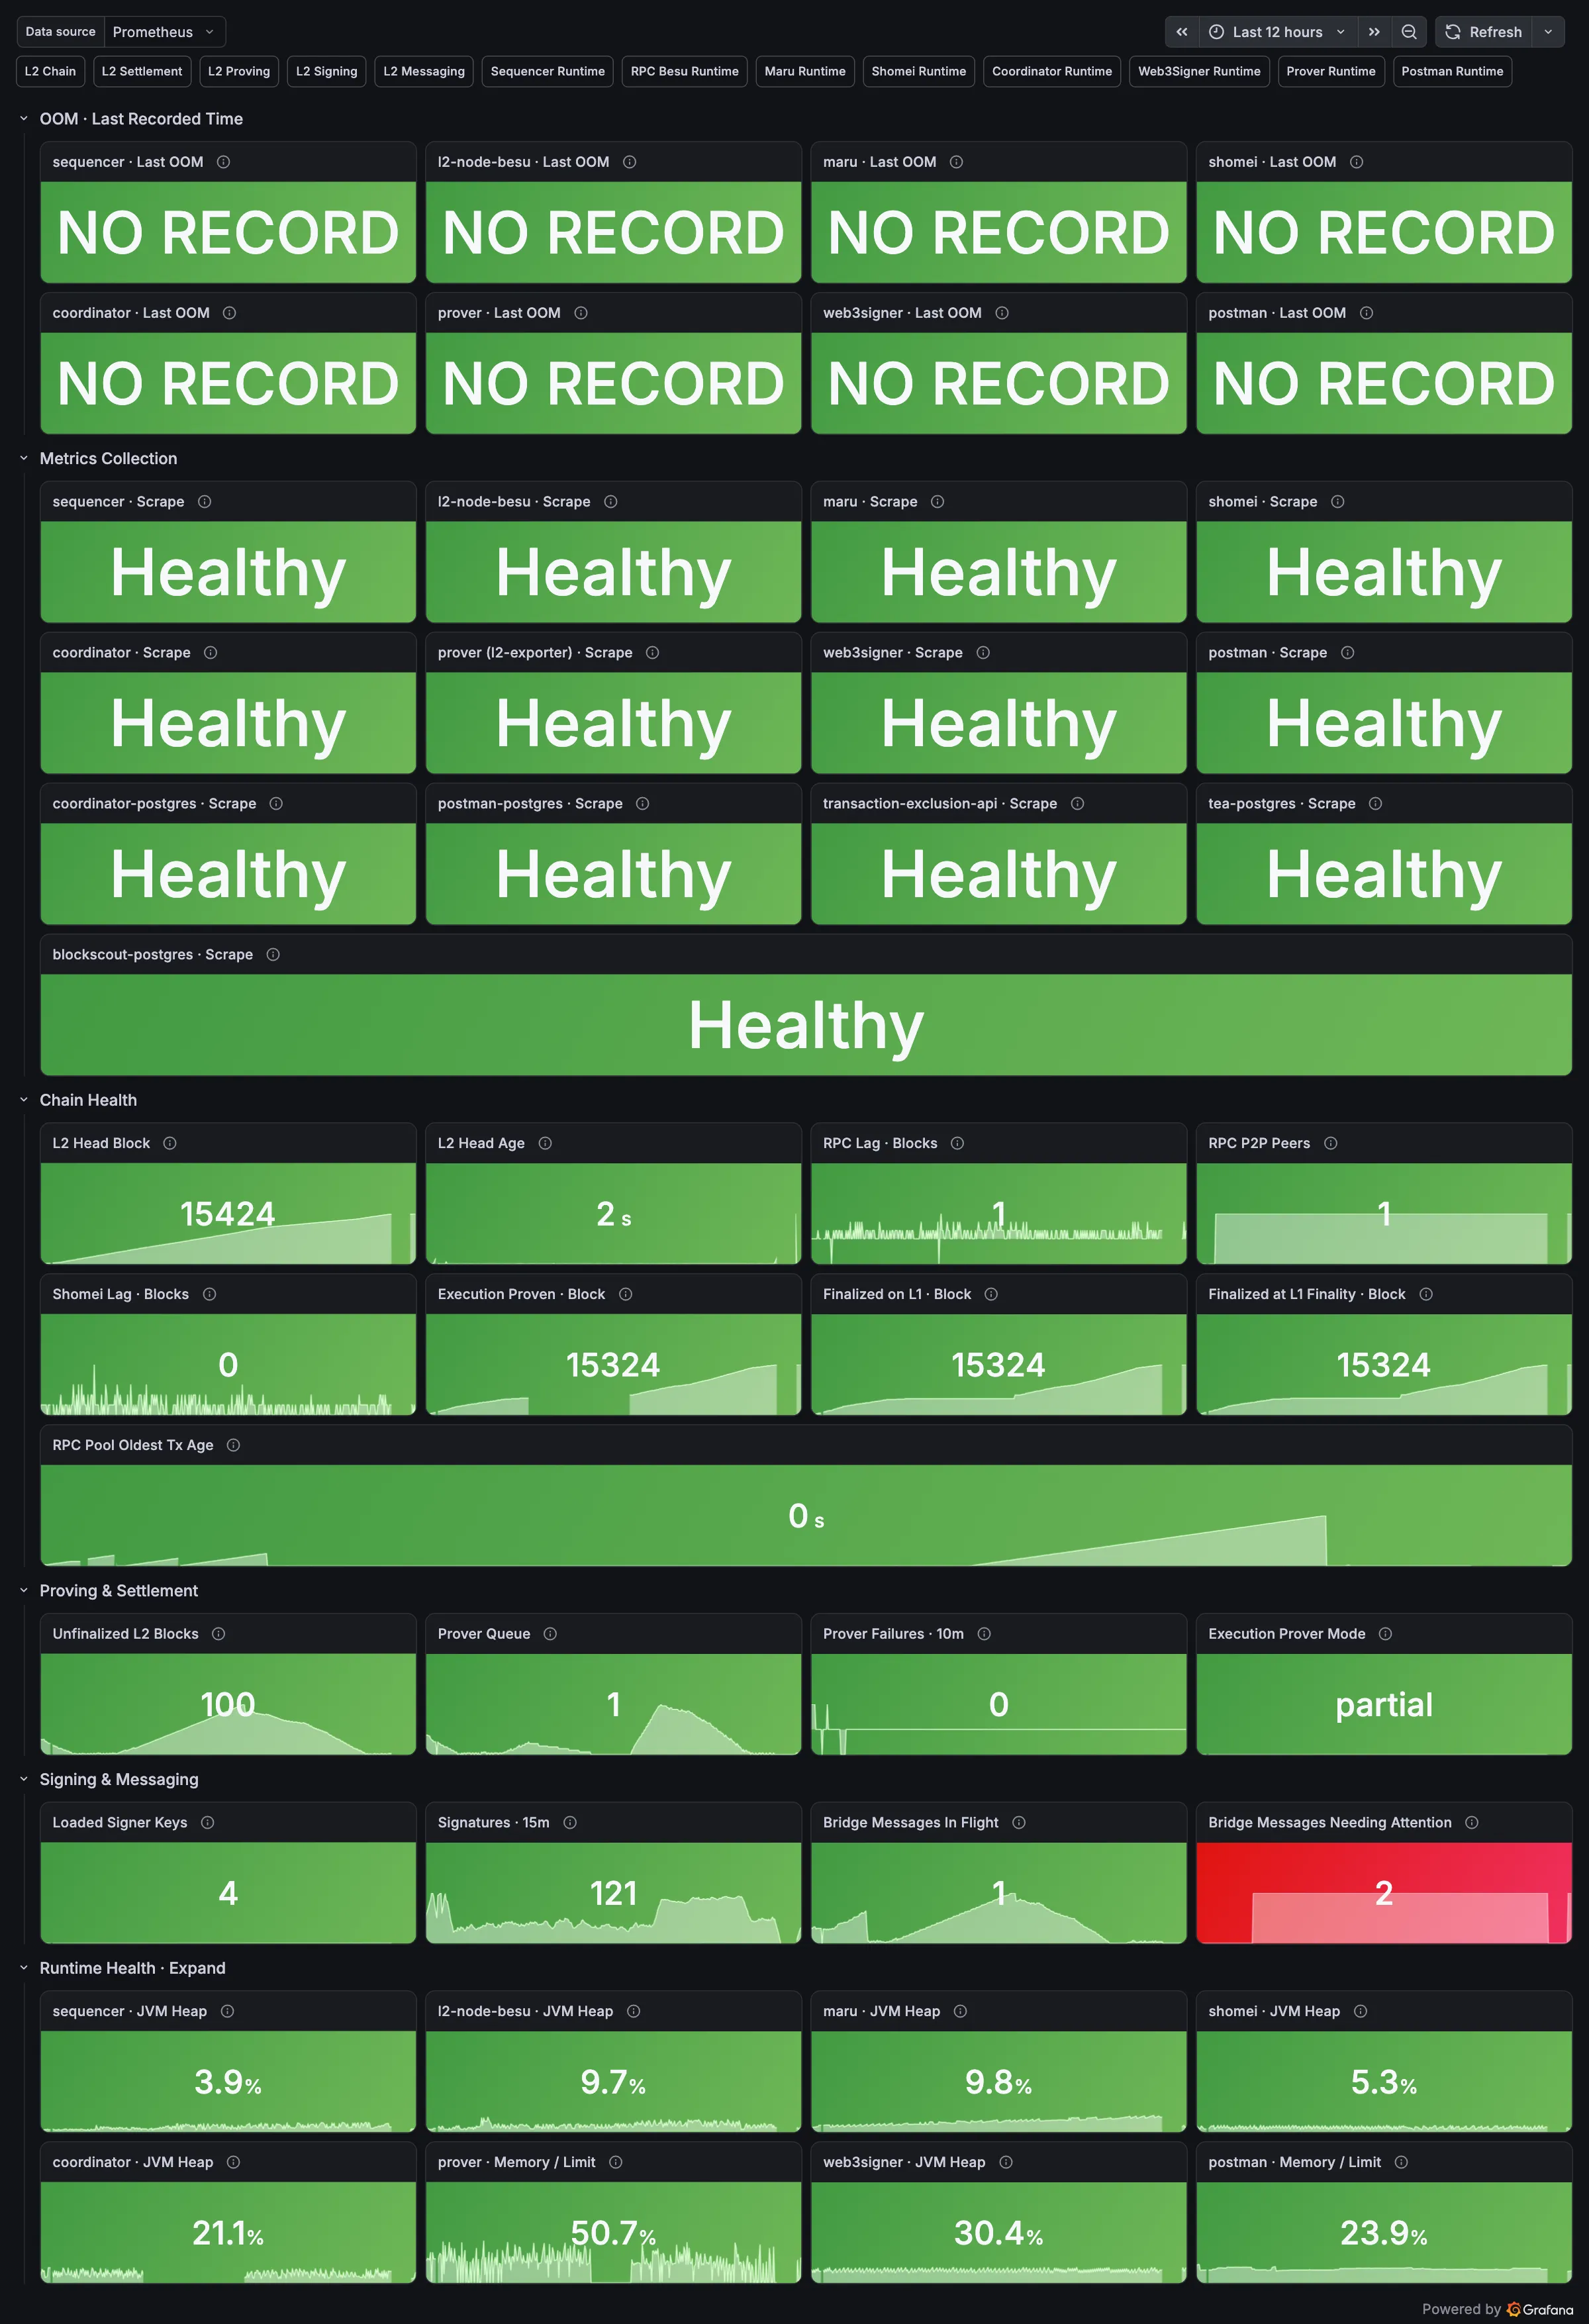
L2 Overview is the entry point: is every target scraped, has anything been OOM-killed, is the chain moving, is proving keeping up, are the signer keys loaded, is any bridge message stuck.
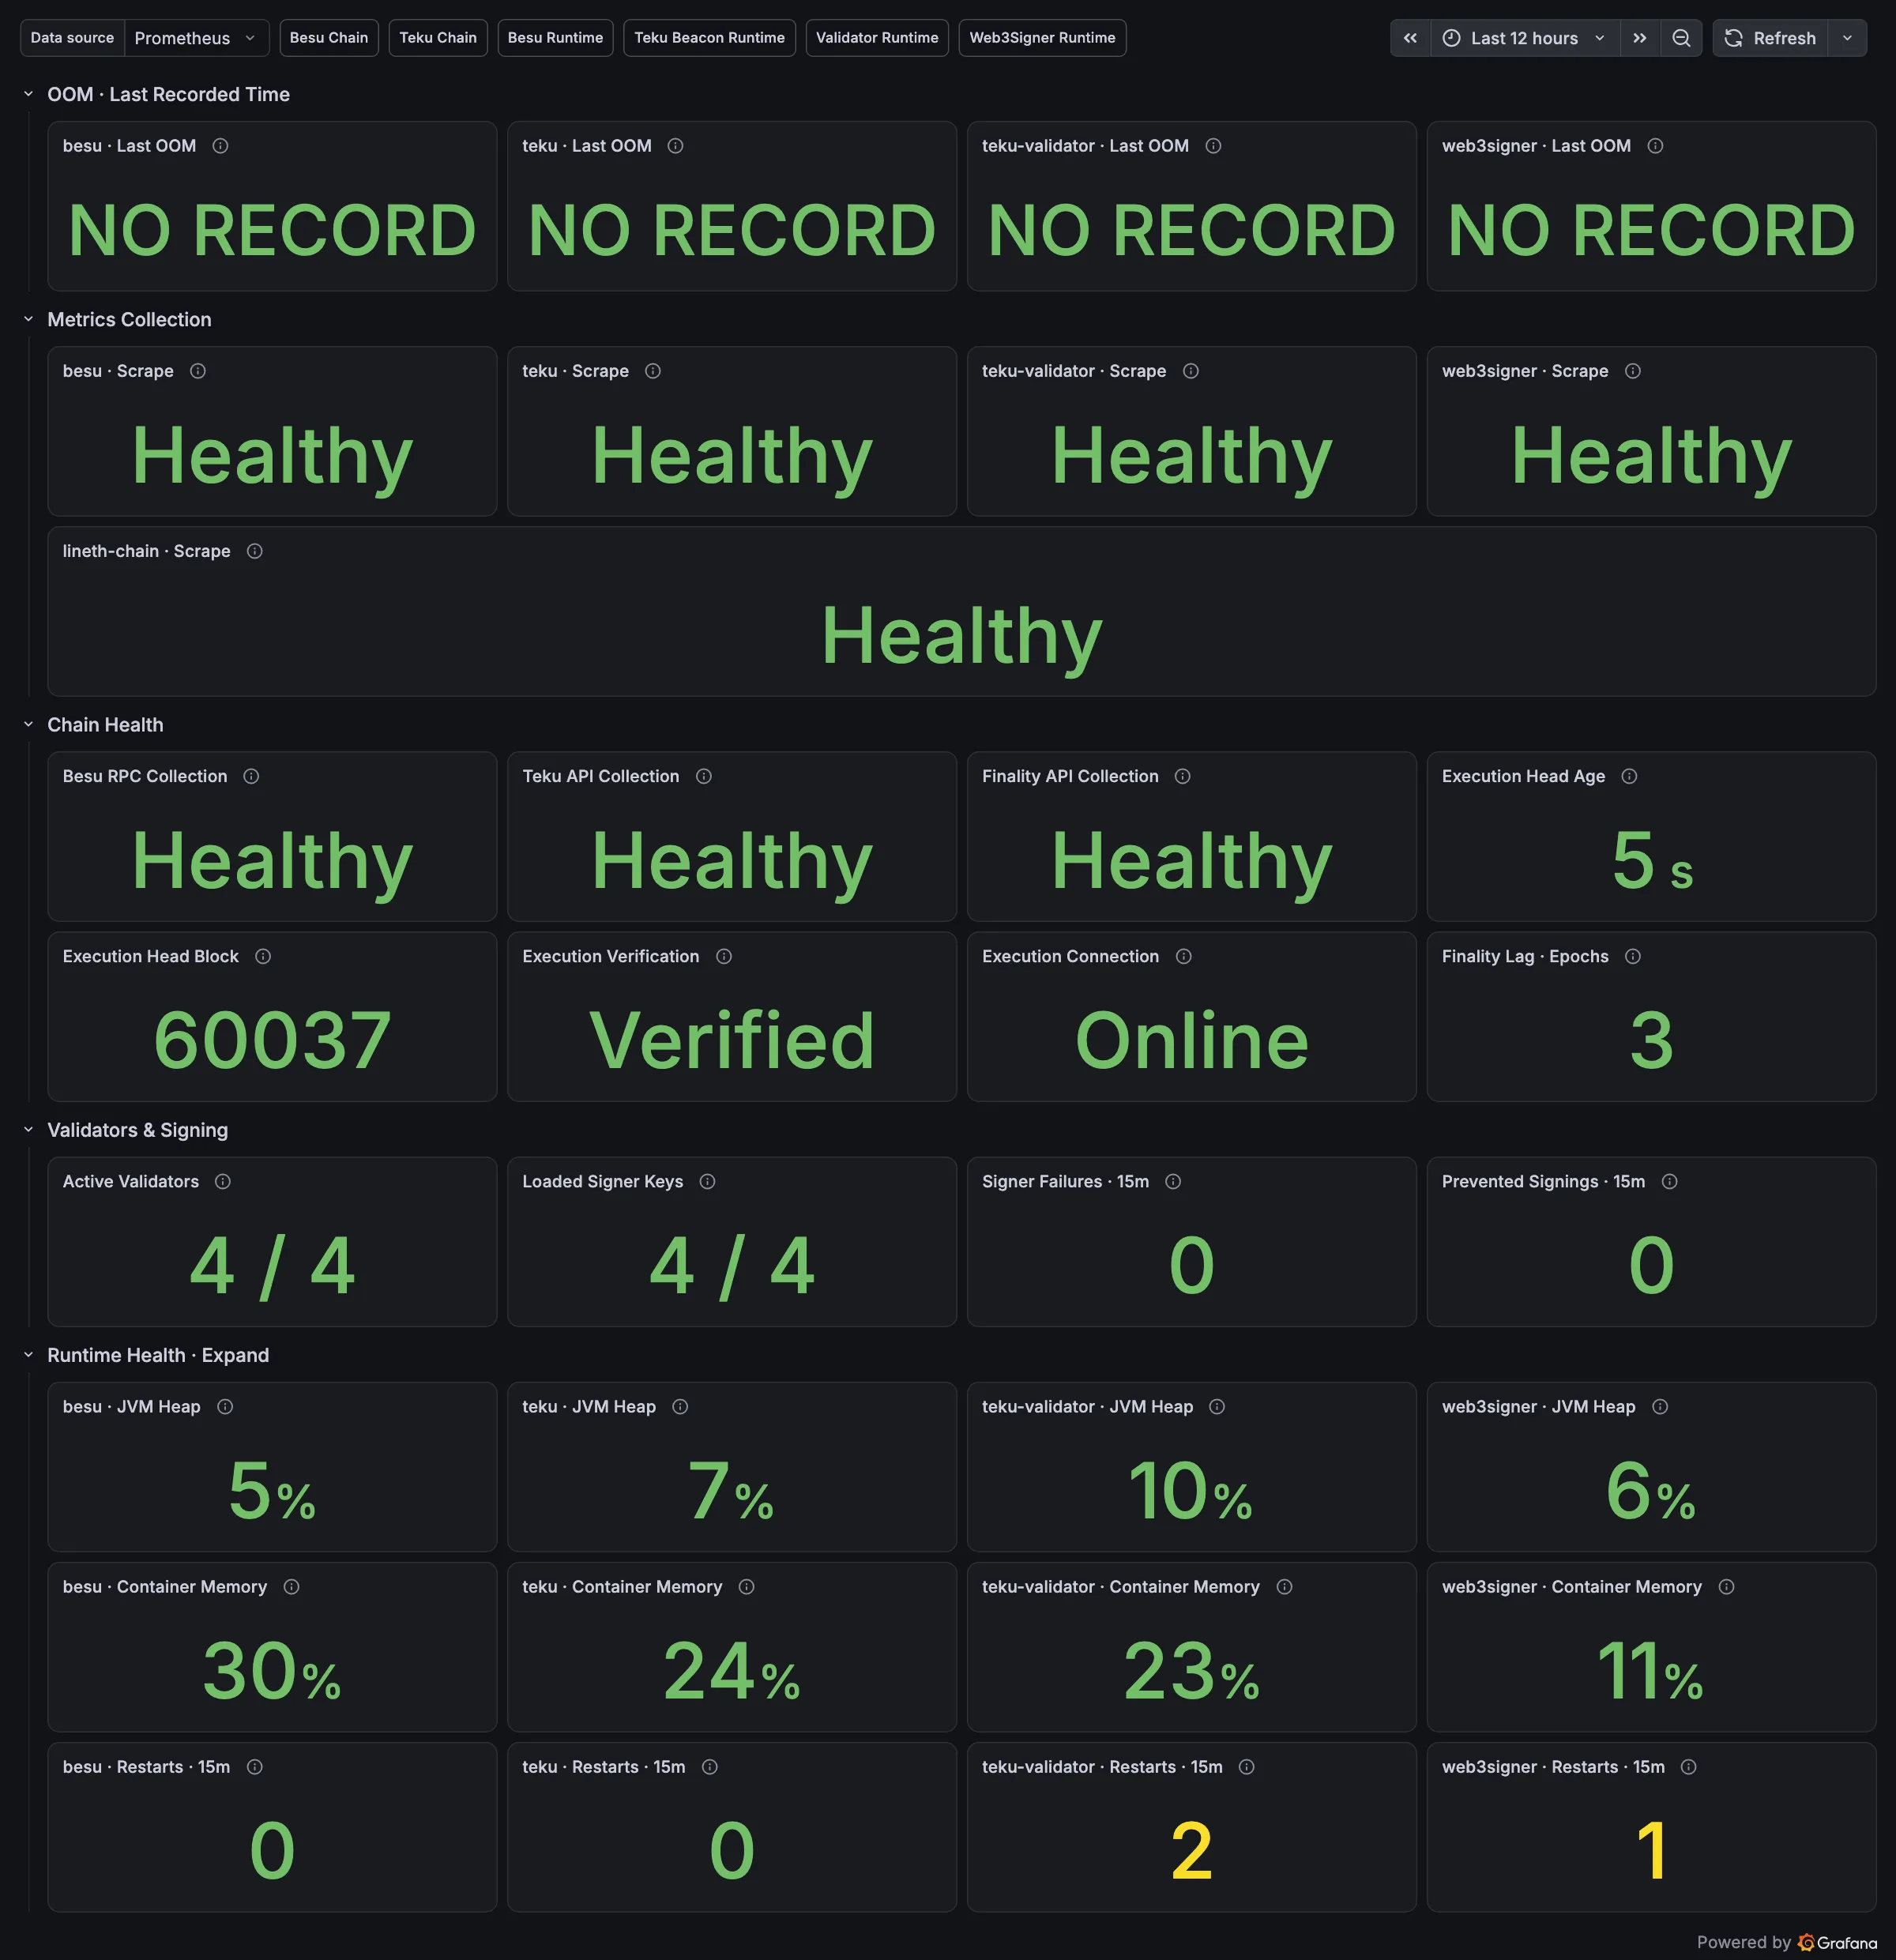
L1 Overview is the same idea for the L1: execution head age, finality lag in epochs, 4/4 validators and signer keys, signing failures, slashing-protection refusals.
SLOs and error budgets
Nine SLOs over a 28-day window, each with multi-window burn-rate alerts (page and ticket), generated from one definitions file:
| SLO | objective | good event |
|---|---|---|
| rpc-availability | 99.5 % | public RPC answers and is ≤ 10 blocks behind the sequencer |
| rpc-server-errors | 99.9 % | RPC requests without a server-side error |
| tx-inclusion-5s / 60s | 90 % / 99 % | user transaction visible on the RPC within 5 s / 60 s |
| block-production | 99.5 % | L2 head advanced |
| settlement-freshness | 99 % | L1 finalization advanced in the last 30 min |
| deposit-2m / 10m | 95 % / 99 % | L1→L2 deposit claimed in time |
| withdrawal-1h | 99 % | L2→L1 withdrawal claimable within 1 h |
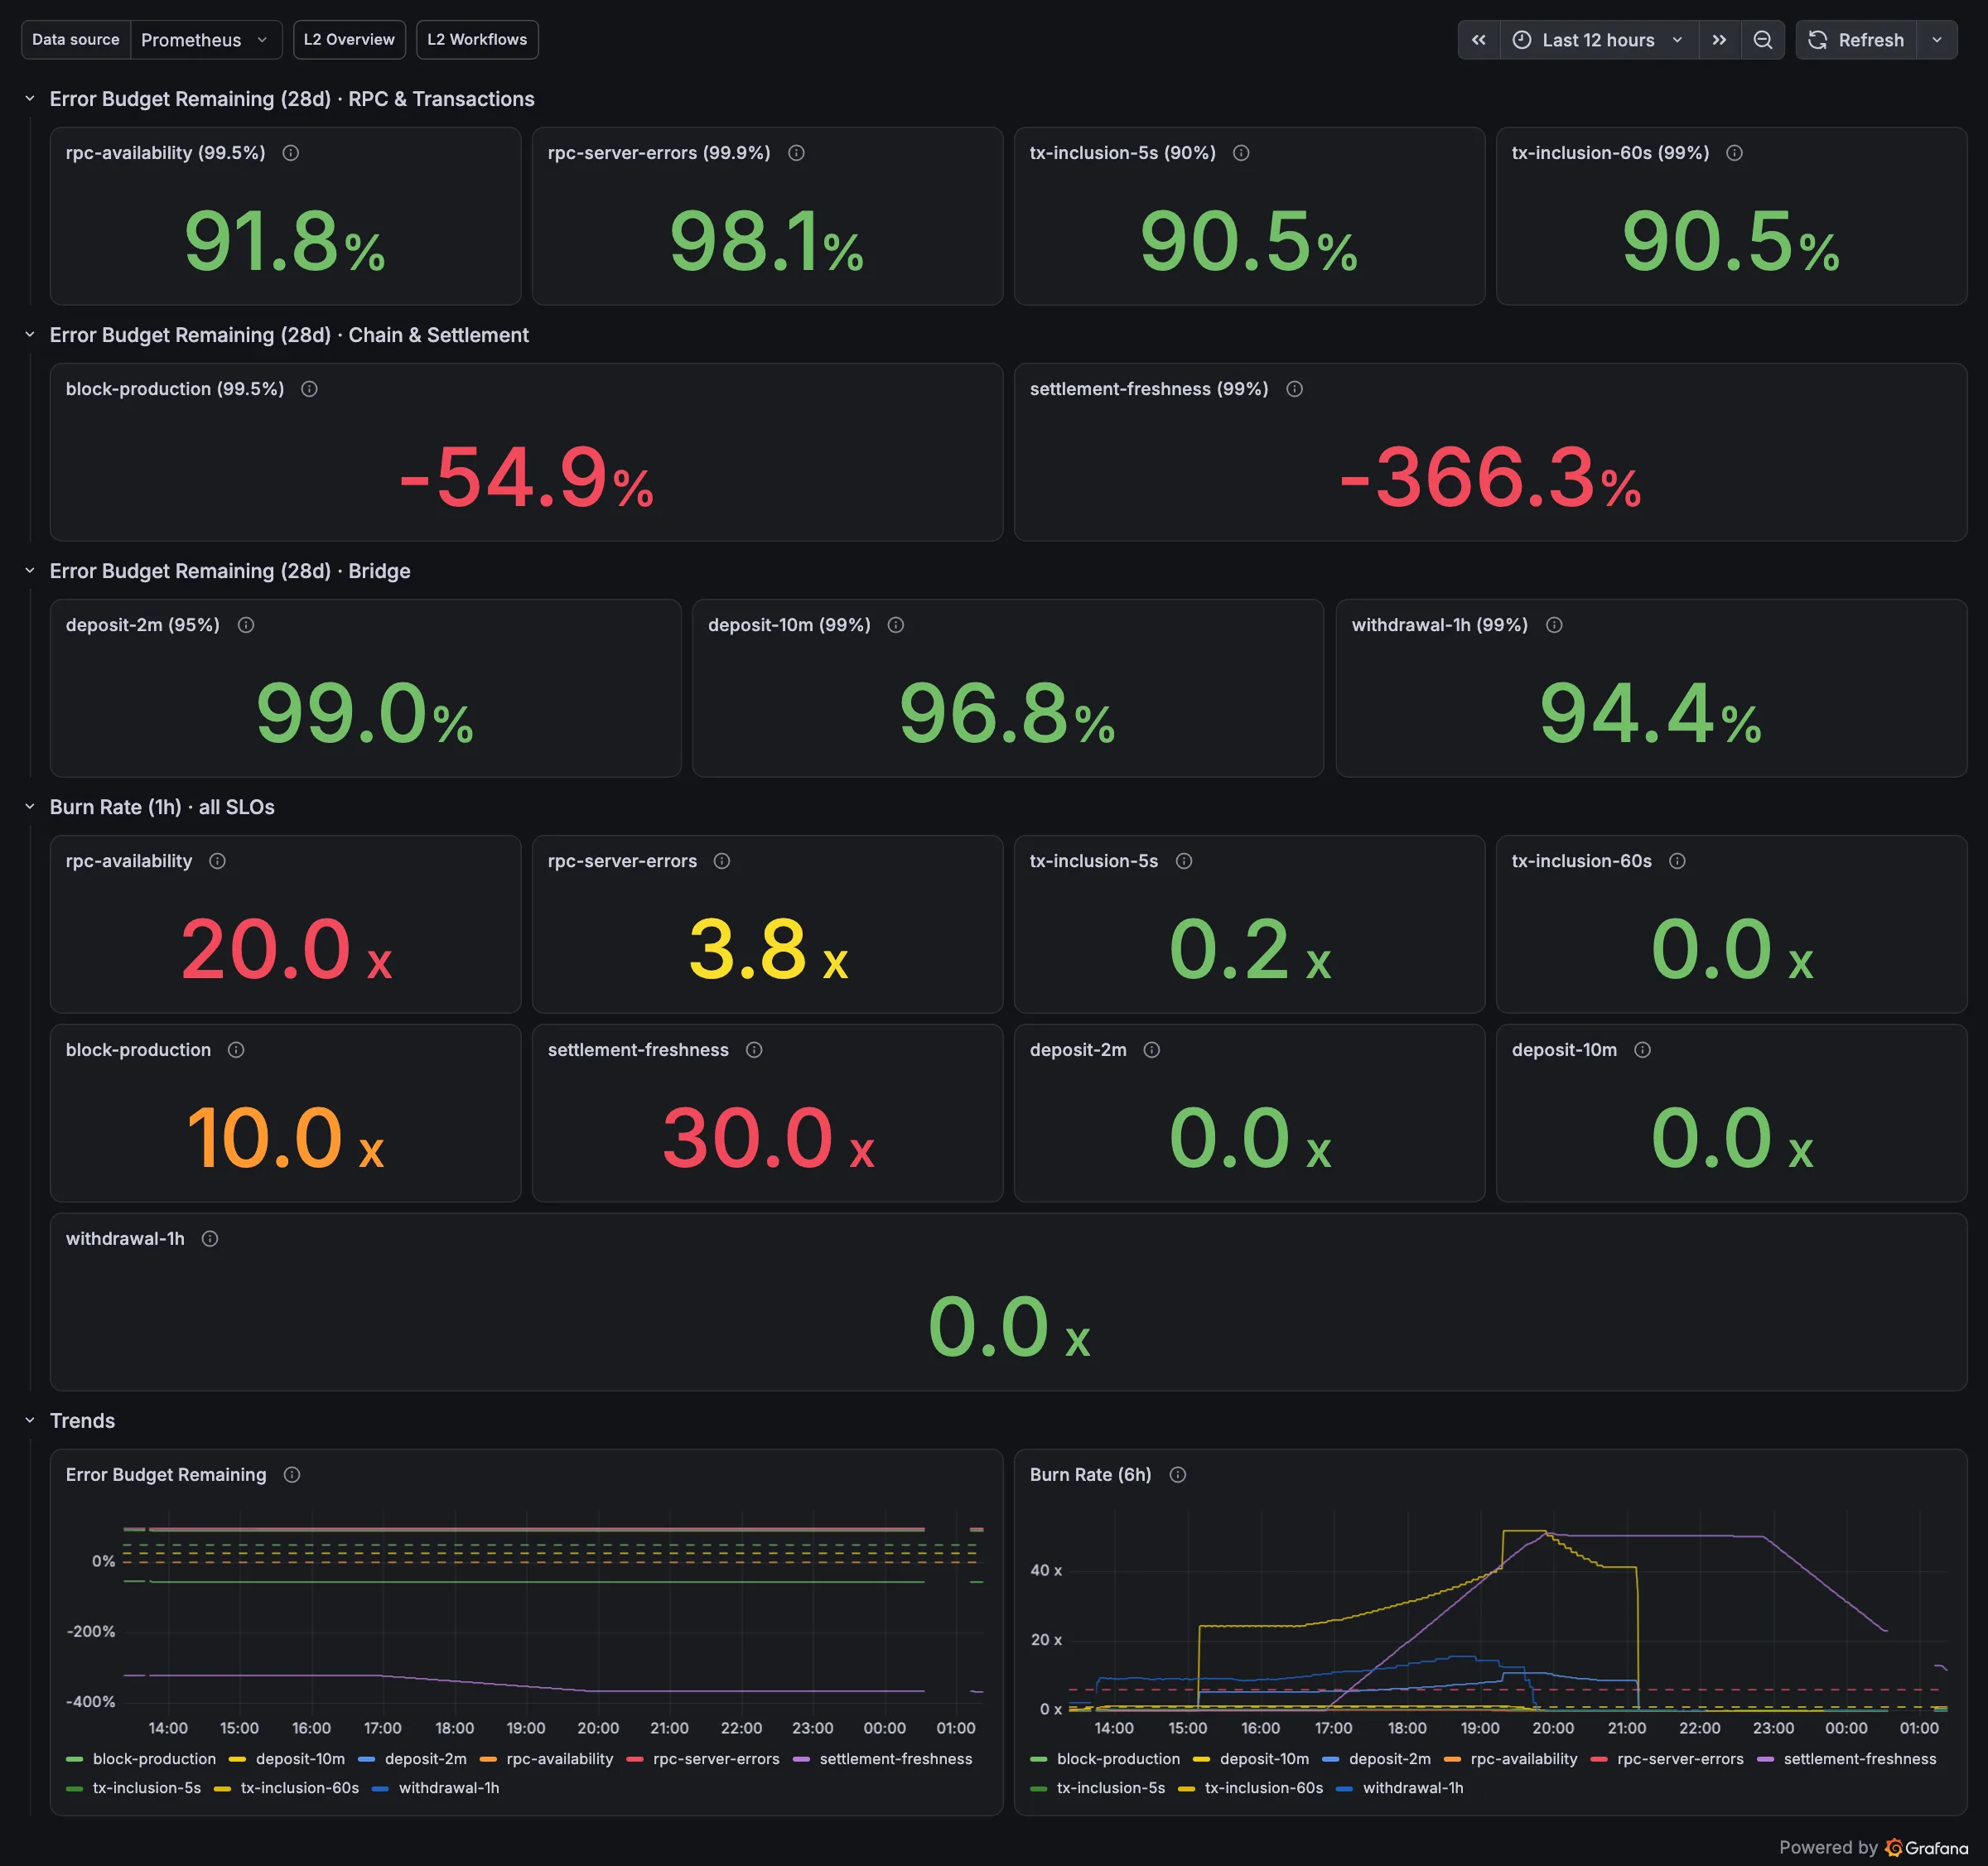
The red numbers are honest: two SLOs are deep below zero after the incidents in the postmortem series, and the 1-hour burn rates are high because the node had been stopped for 40 minutes shortly before this screenshot. The SLOs also taught me where they lie: three of the postmortems end with an SLI that could not see the failure (unfinished transactions not counted, lag invisible to “did it move”, and a latency SLI whose denominator dropped every request slower than two hours).
Workflows: tracing the user’s journey, not the pods
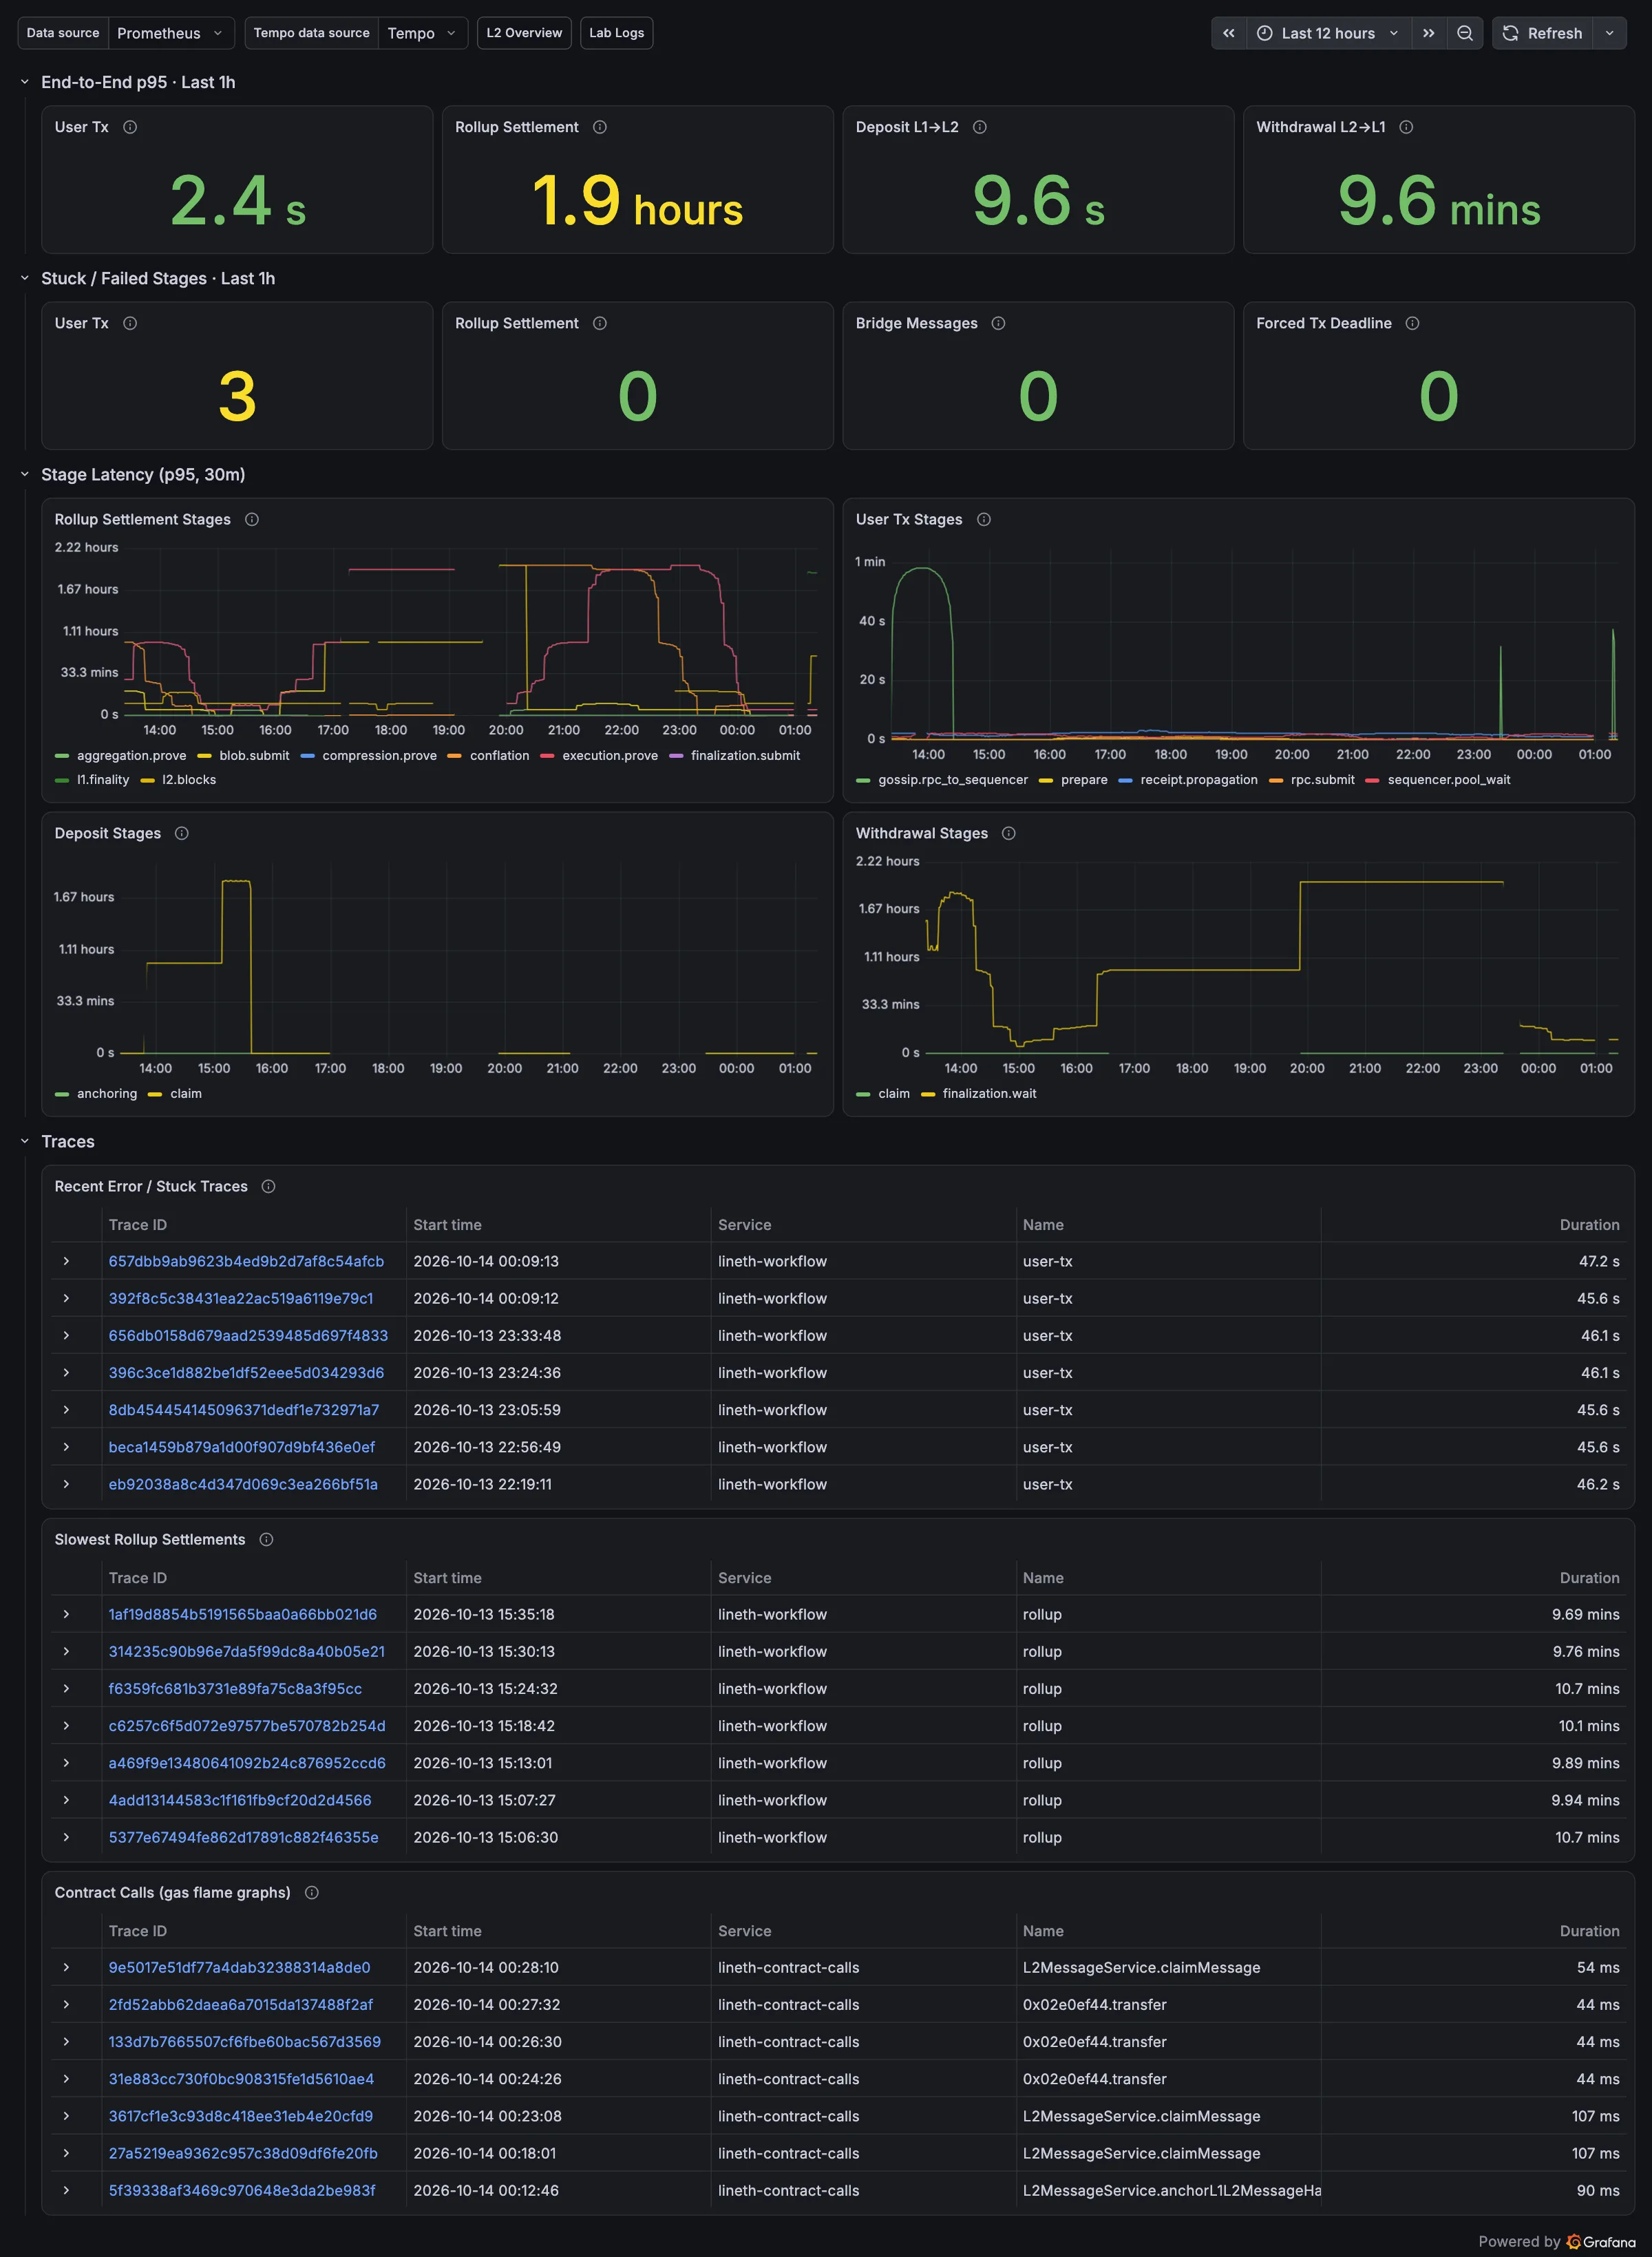
Pod metrics say whether components are up. They do not say how long a withdrawal takes. For that, every workflow is a trace in Tempo with one span per stage:
| workflow | stages |
|---|---|
| user-tx | rpc.submit → gossip to sequencer → pool wait → receipt visible |
| rollup | L2 blocks → conflation → proving → blob submit → aggregation → finalization → L1 finality |
| deposit | anchoring → claim |
| withdrawal | finalization wait → claim |
The user-tx spans come from the traffic generators themselves (bash and a Python OTel SDK client); the rollup and bridge spans are rebuilt by a workflow-tracer from prover files and L1/L2 contract events. Tempo turns the stage spans into metrics, so p95 latency per stage is a normal Prometheus query, and every trace links to its logs in Loki.
Logs
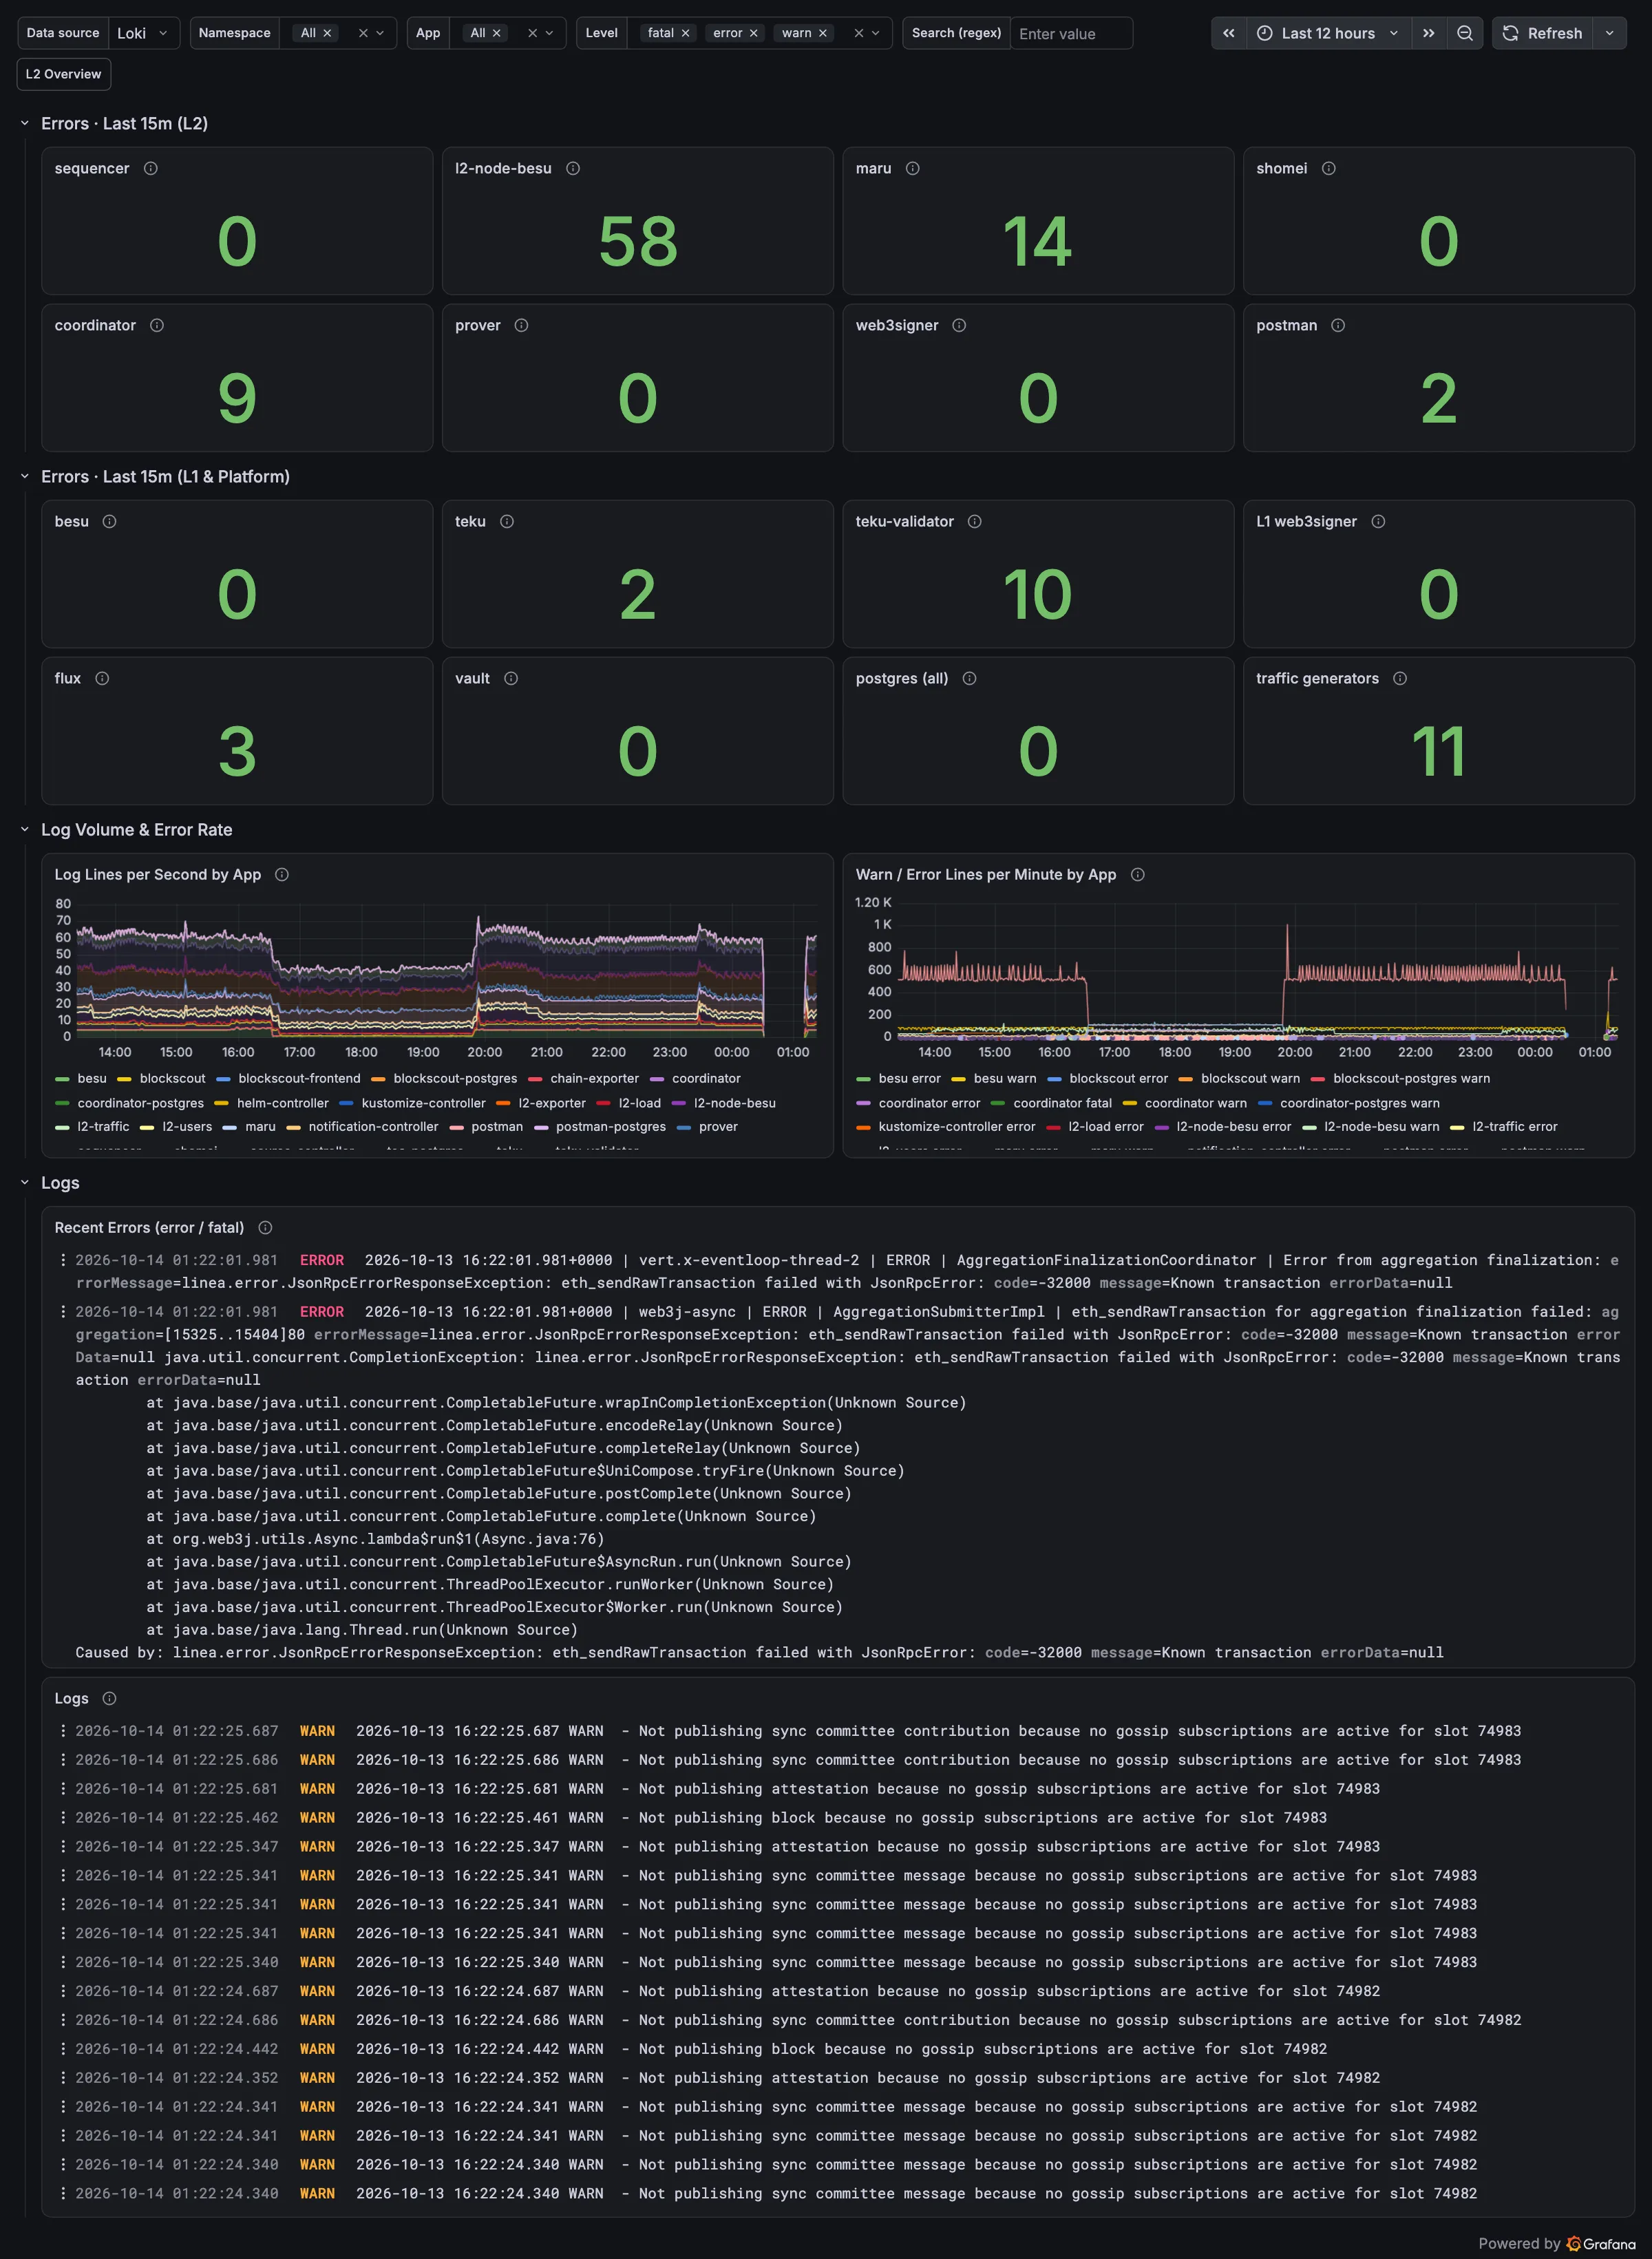
Lab Logs puts the error count of the last 15 minutes per component in the same order as the overview, then log volume and error rate per app, then the raw error and log streams, filterable by namespace, app, level and regex.
Pipeline dashboards
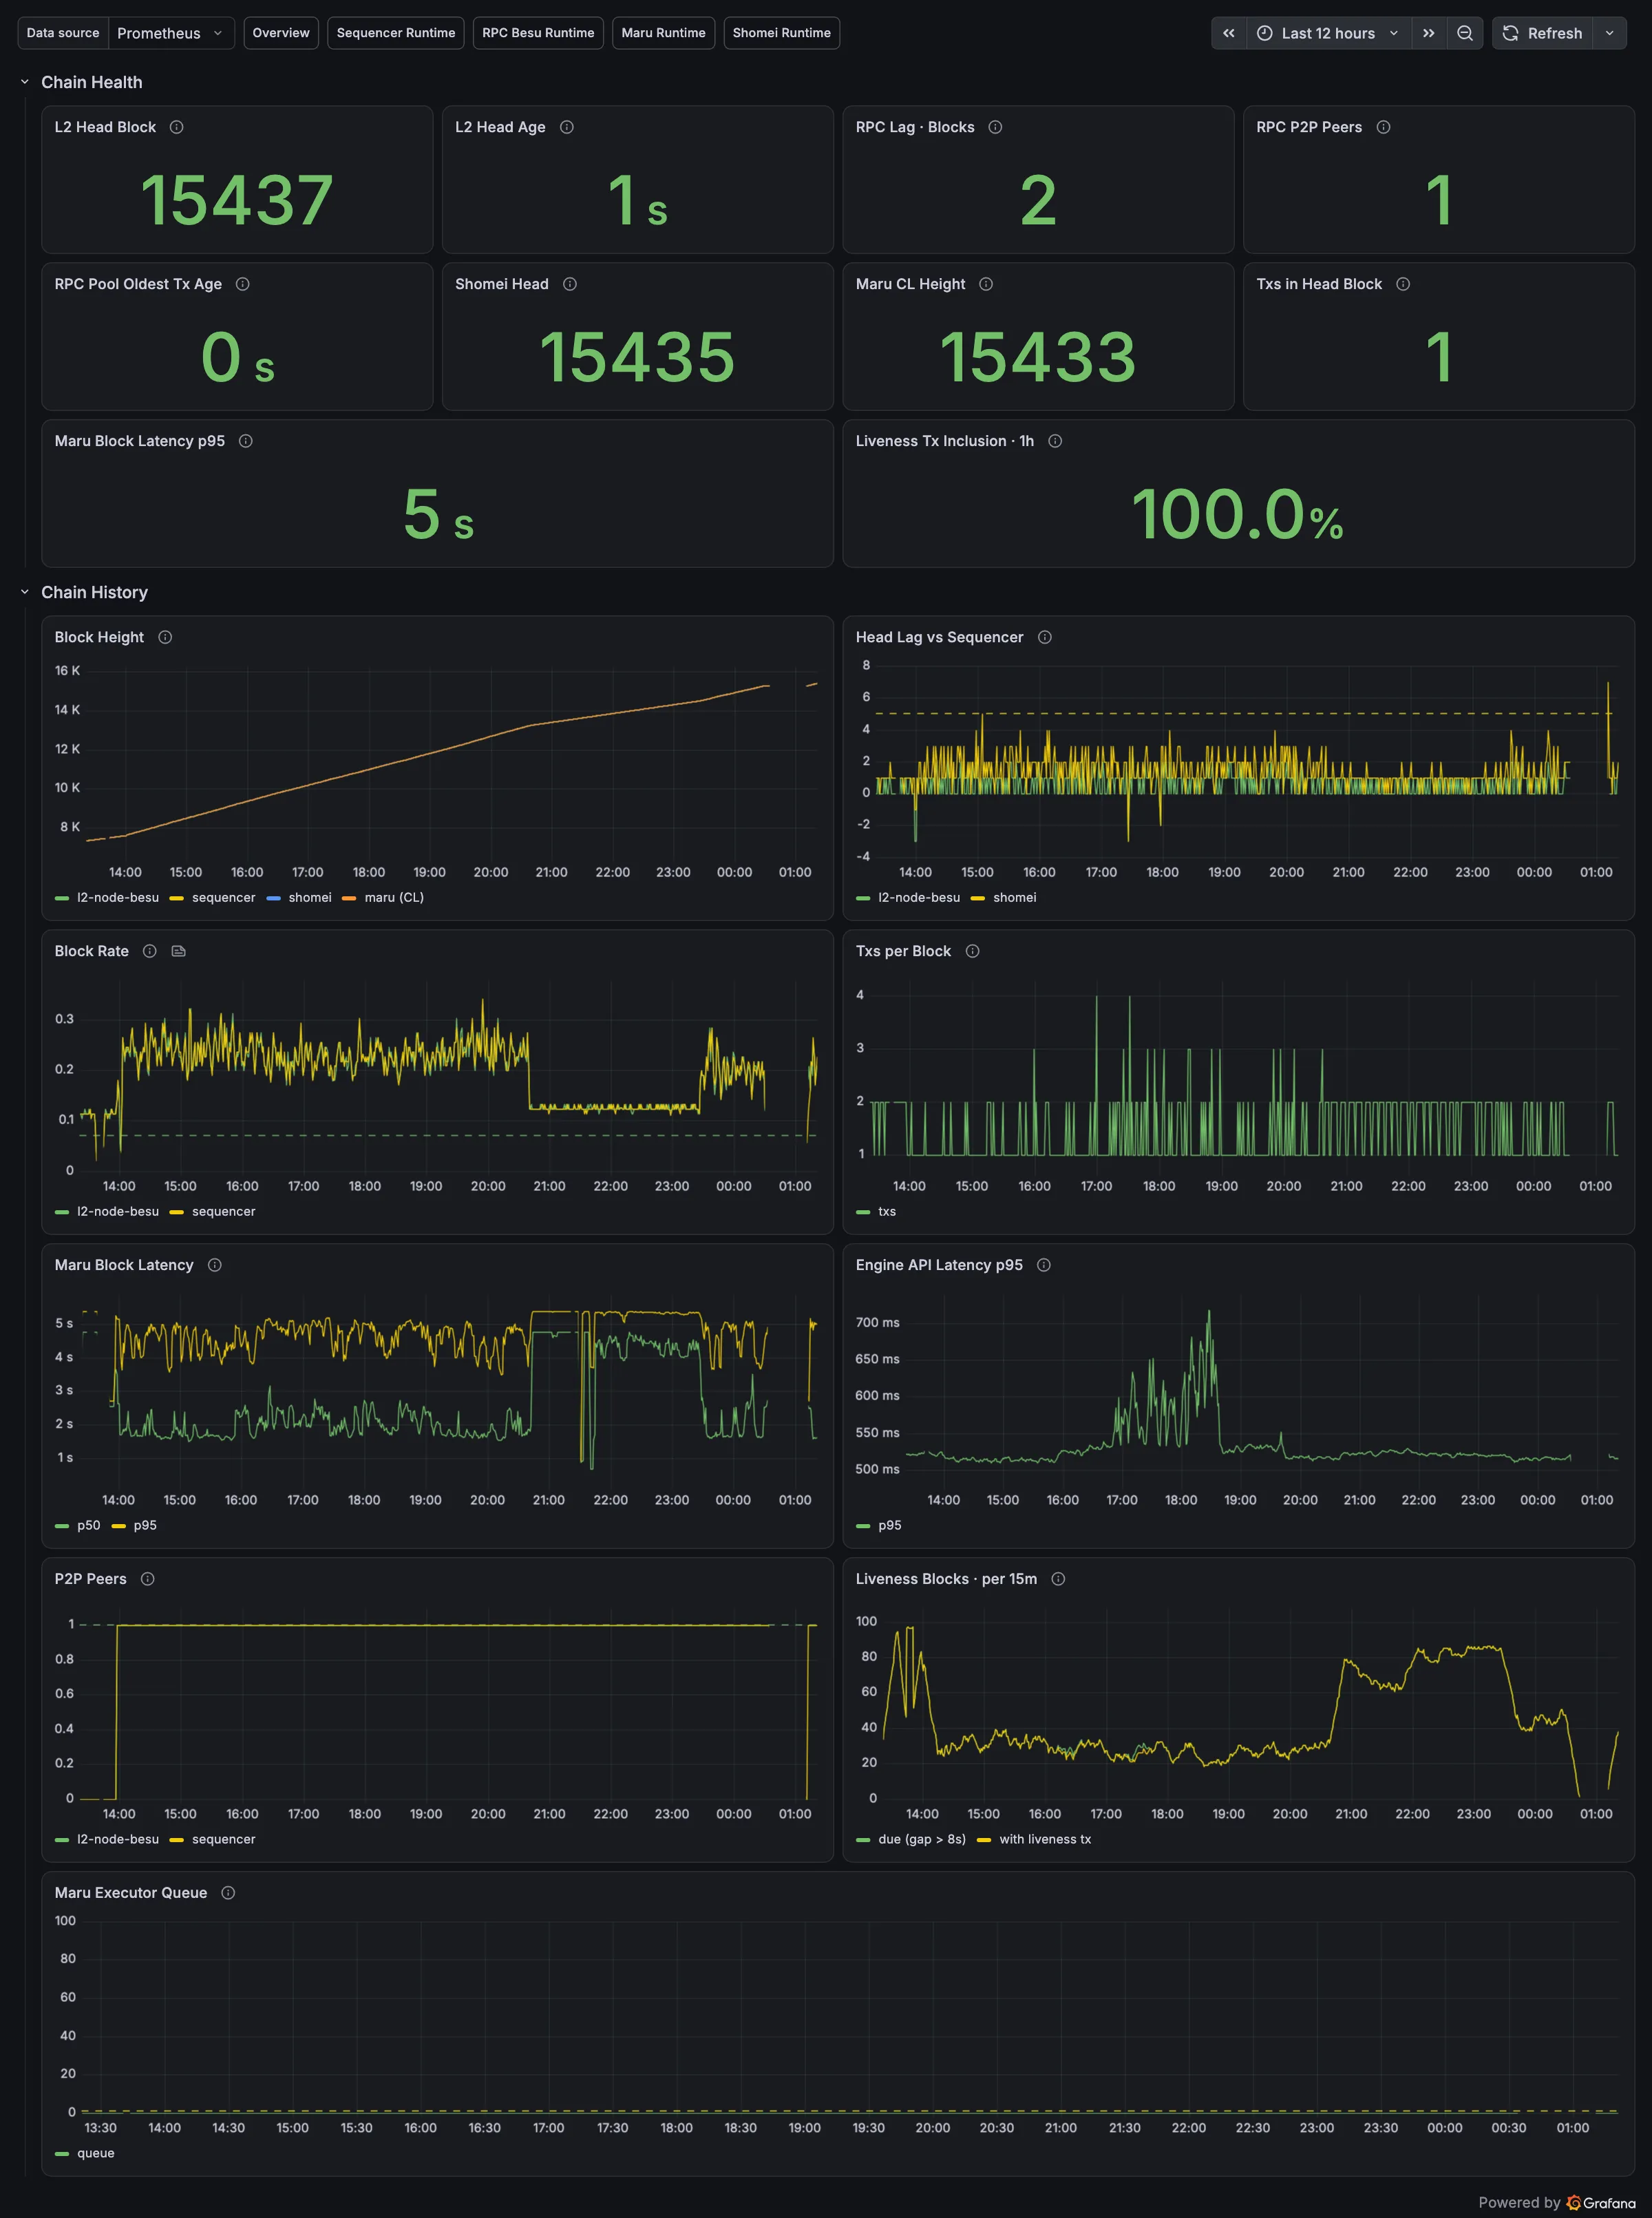
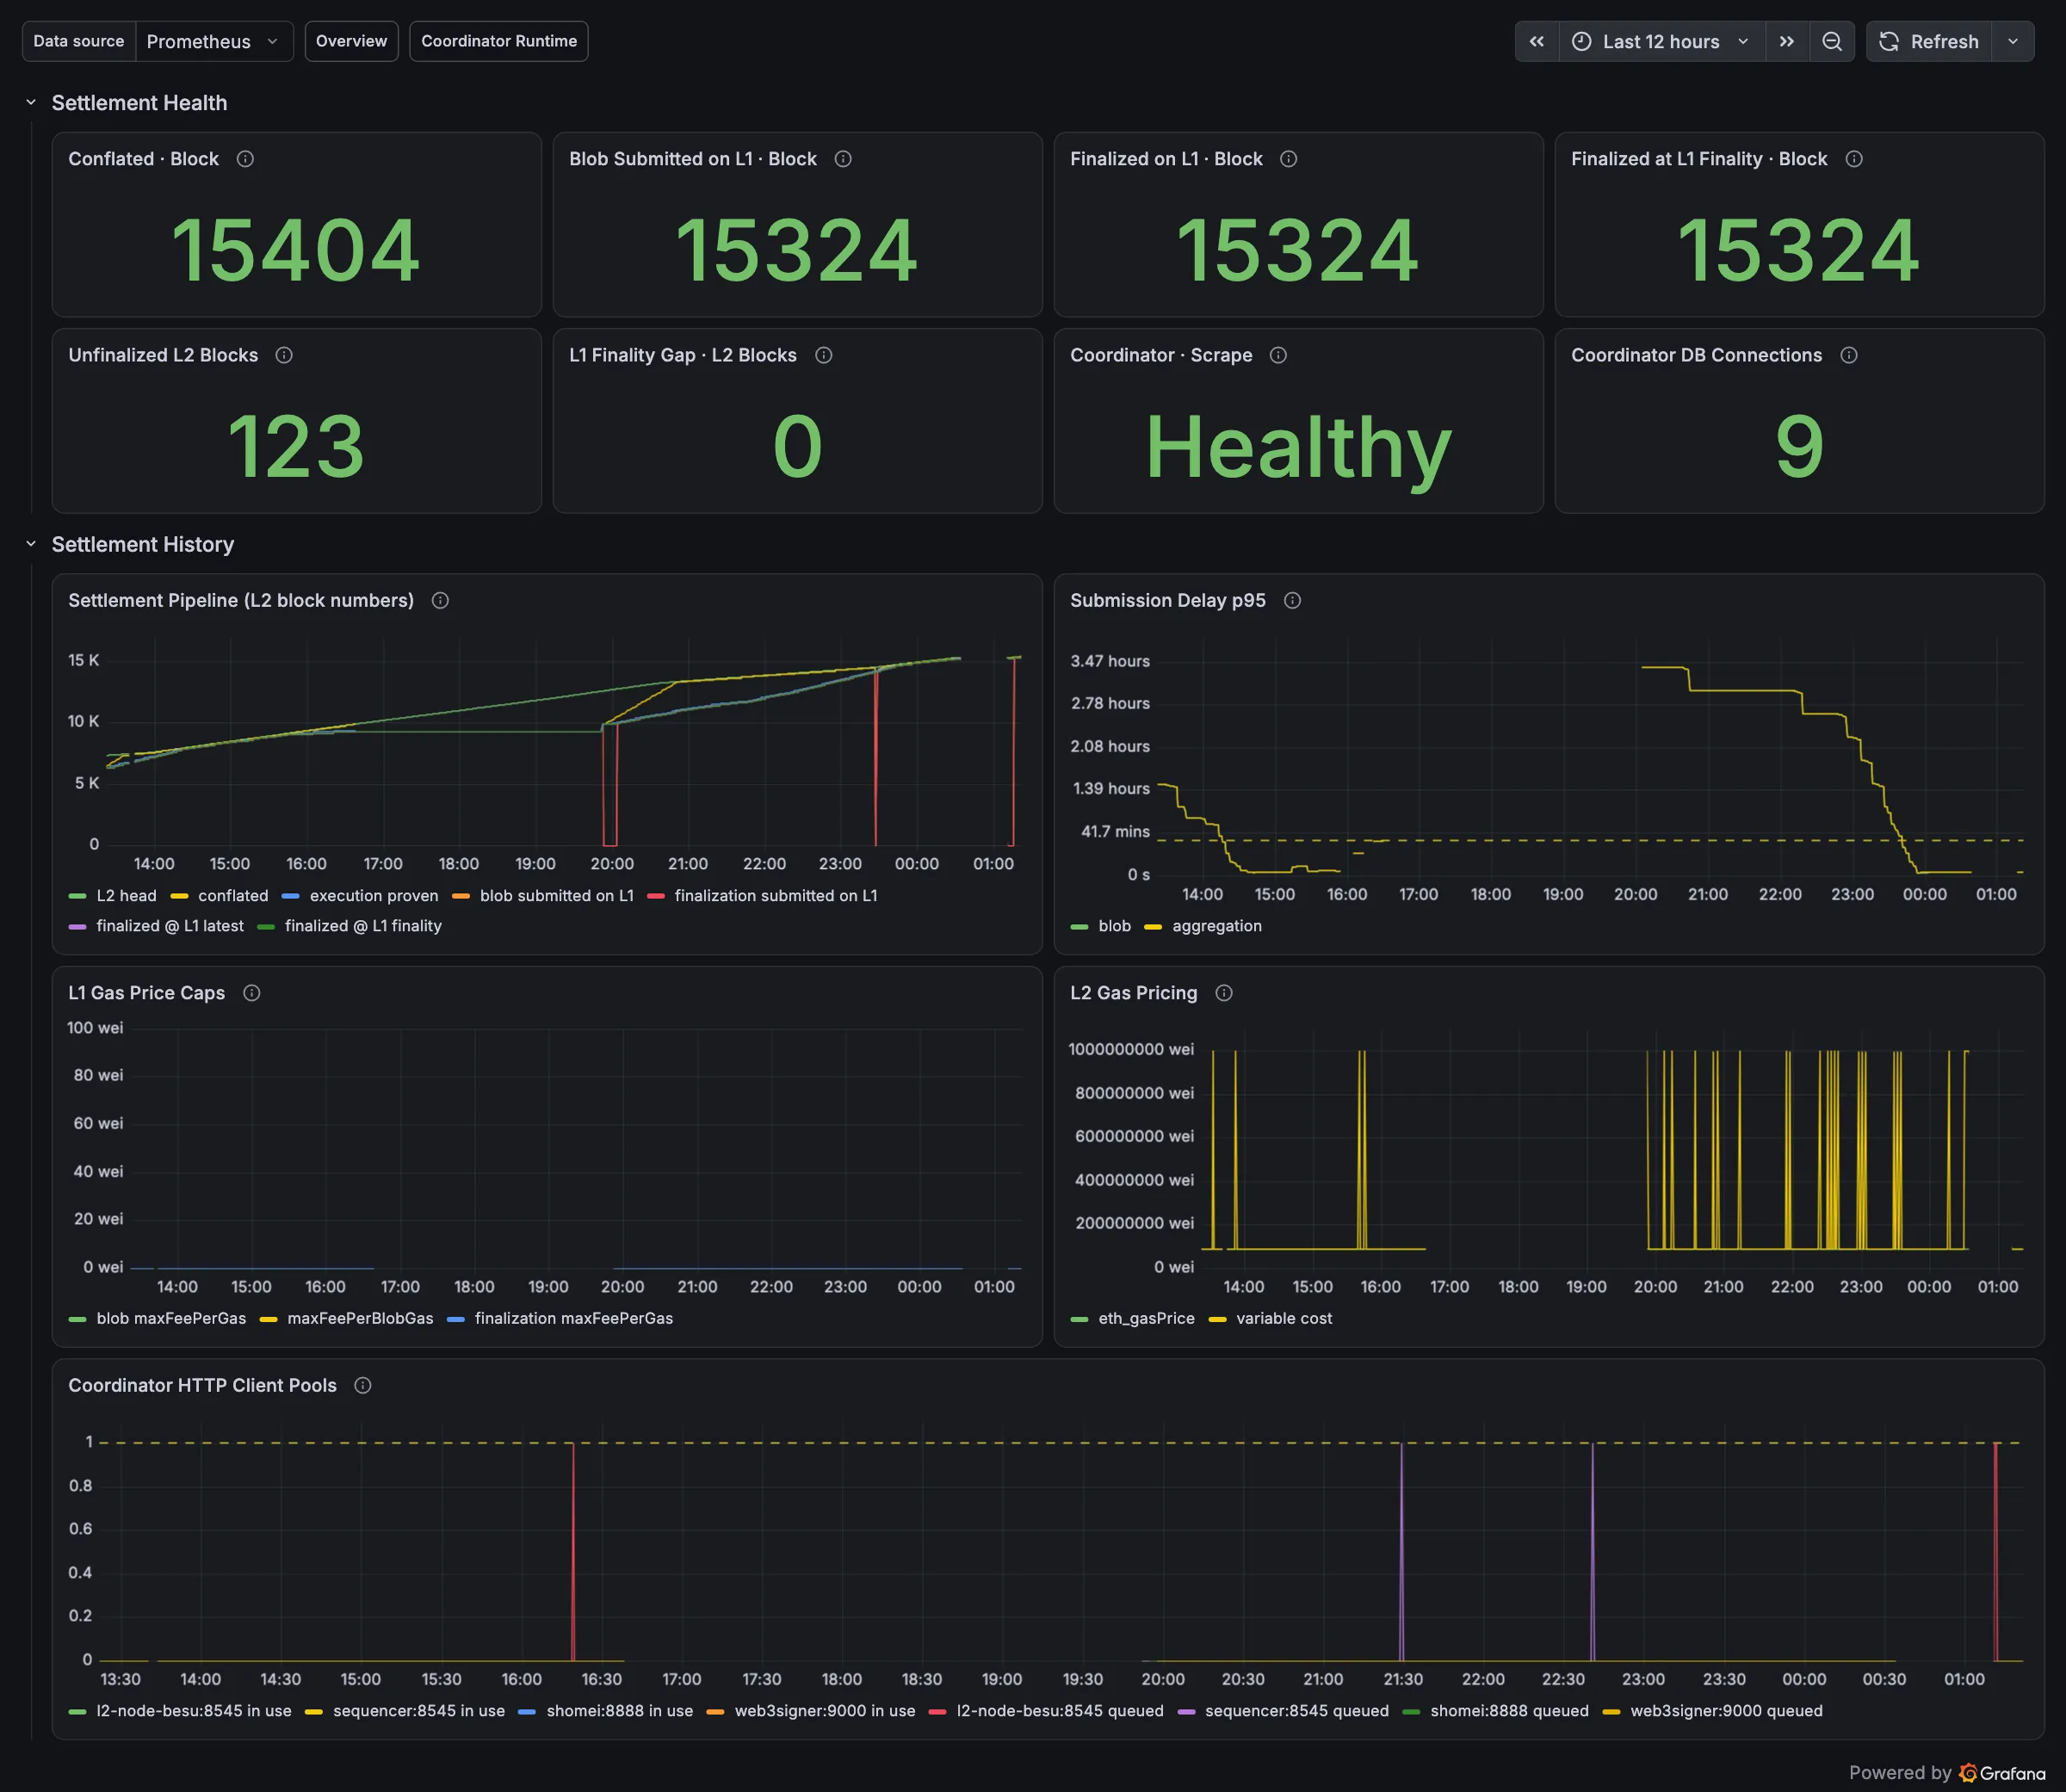
One dashboard per stage of the rollup pipeline: chain, proving, settlement, signing, messaging.
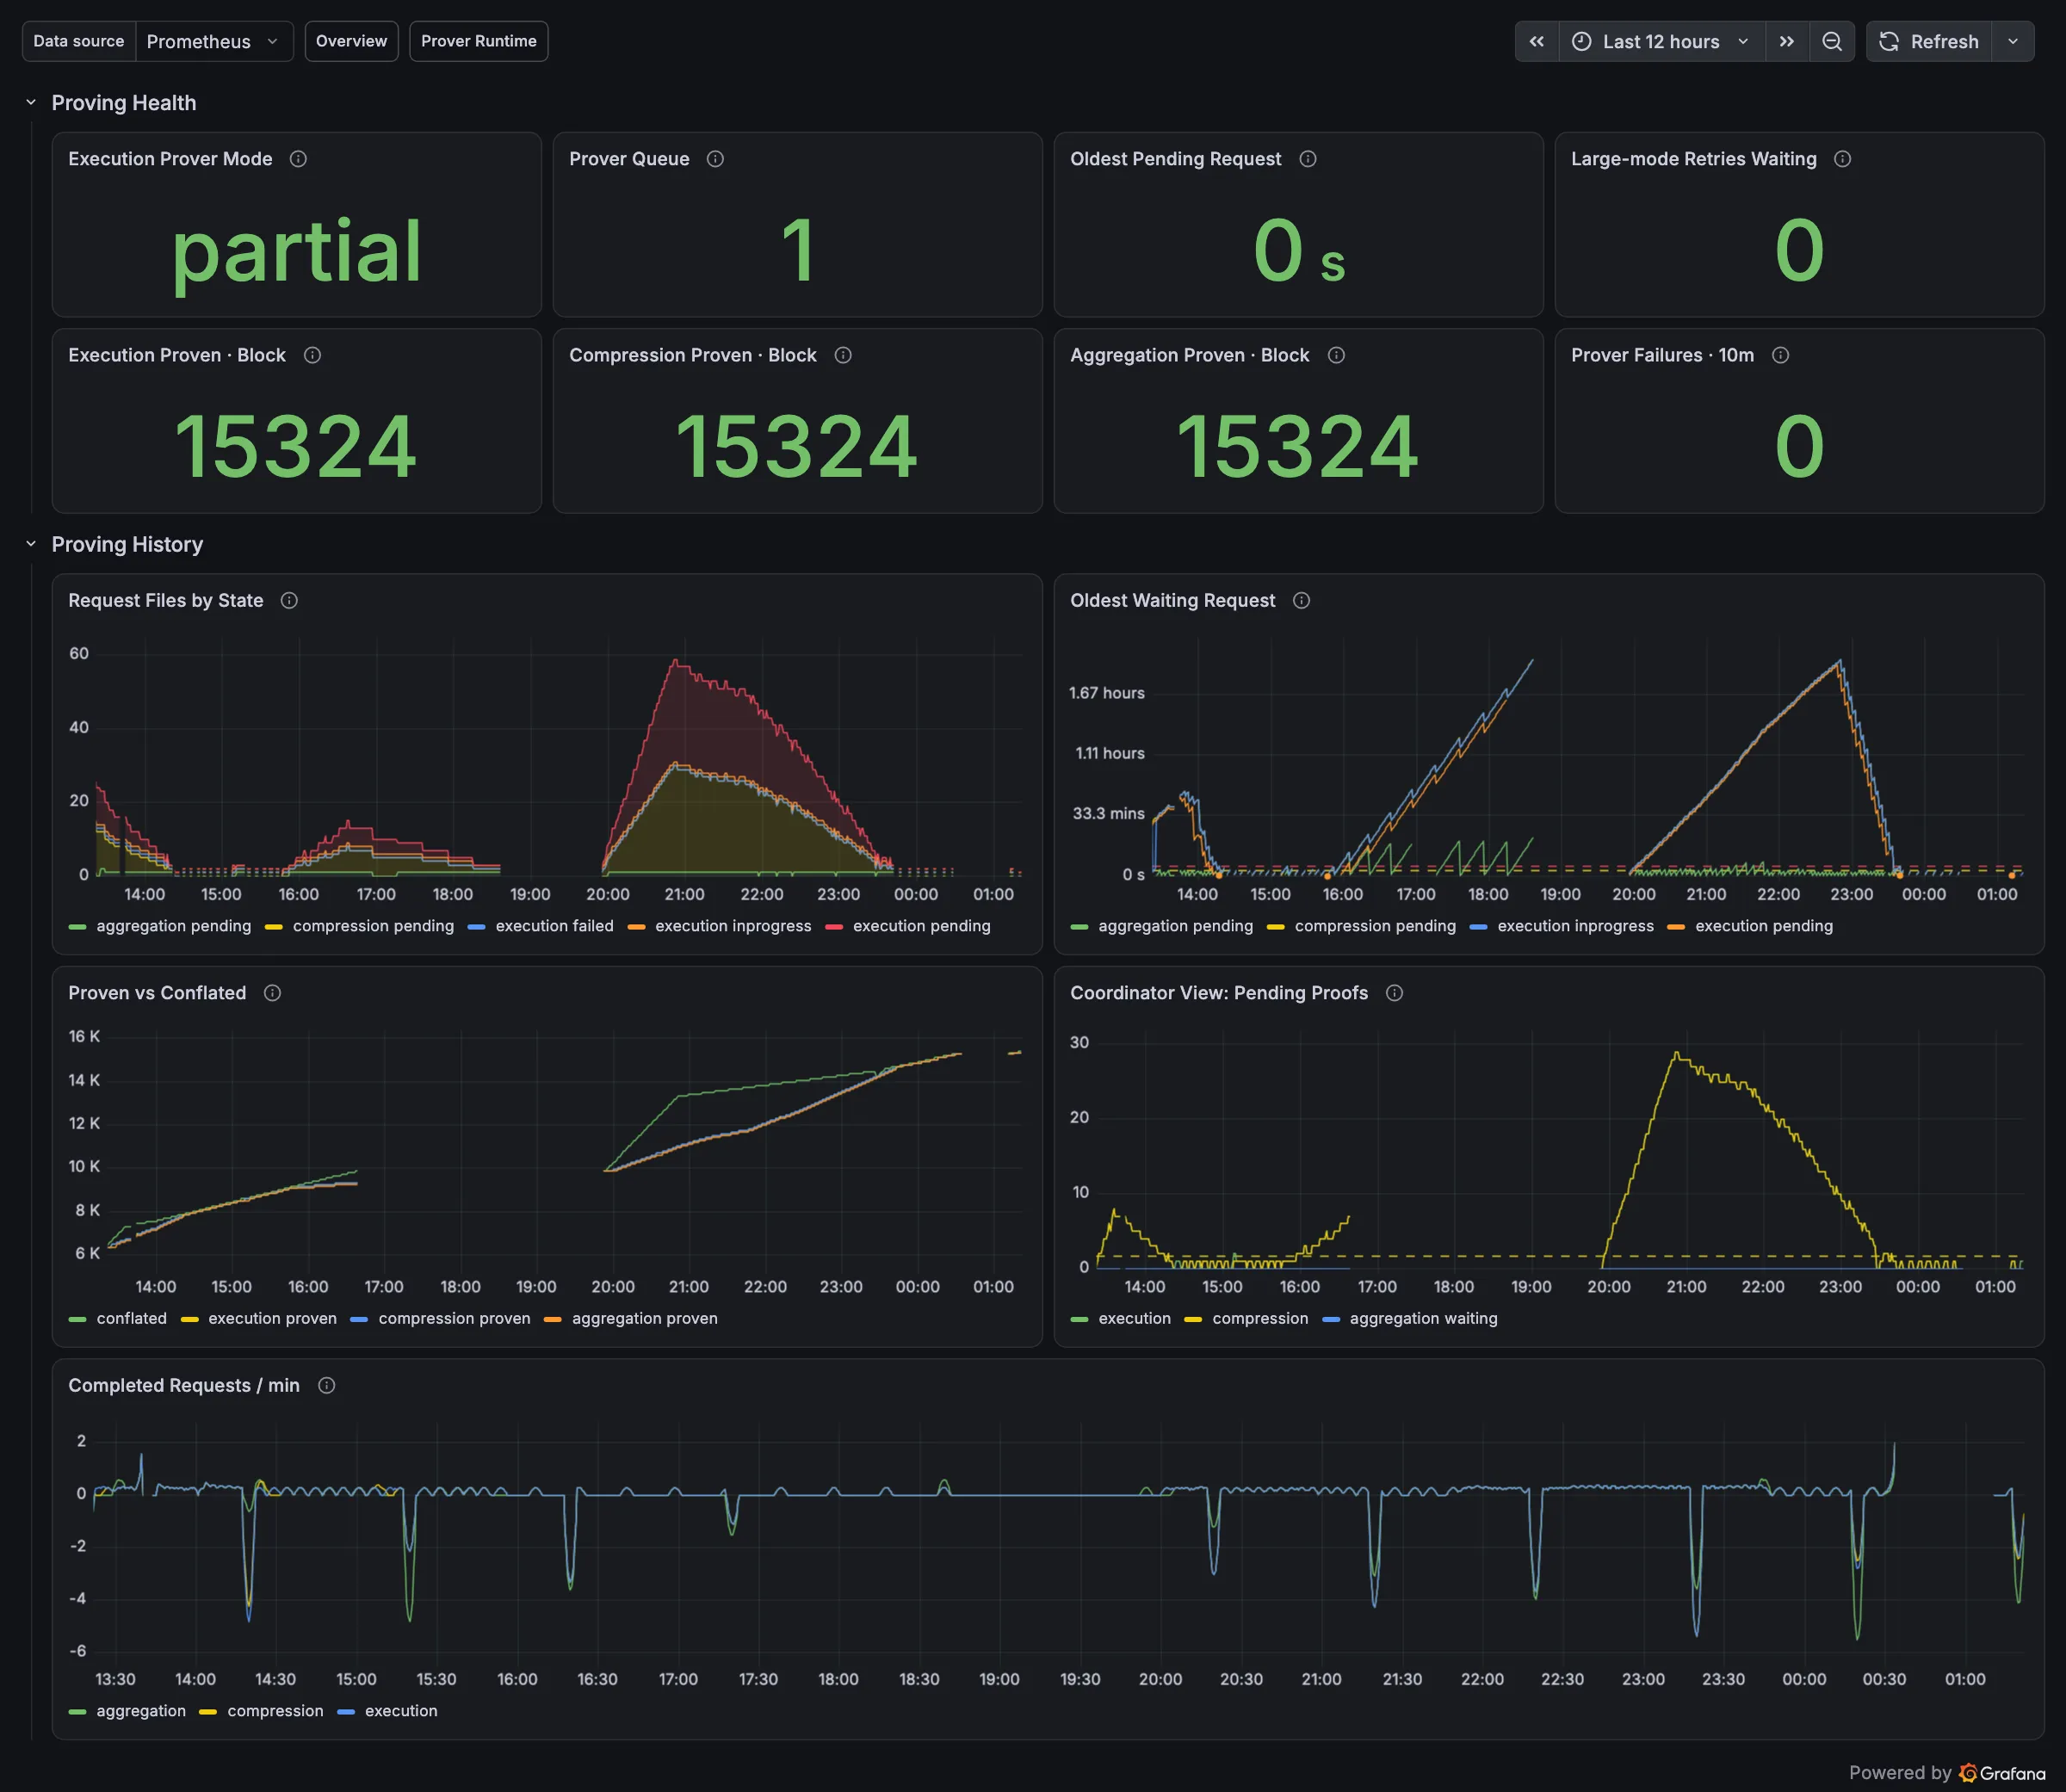
The proving history above shows the catch-up after the L1 deadlock: the execution backlog rises to ~60 request files around 20:40, and drains by midnight.
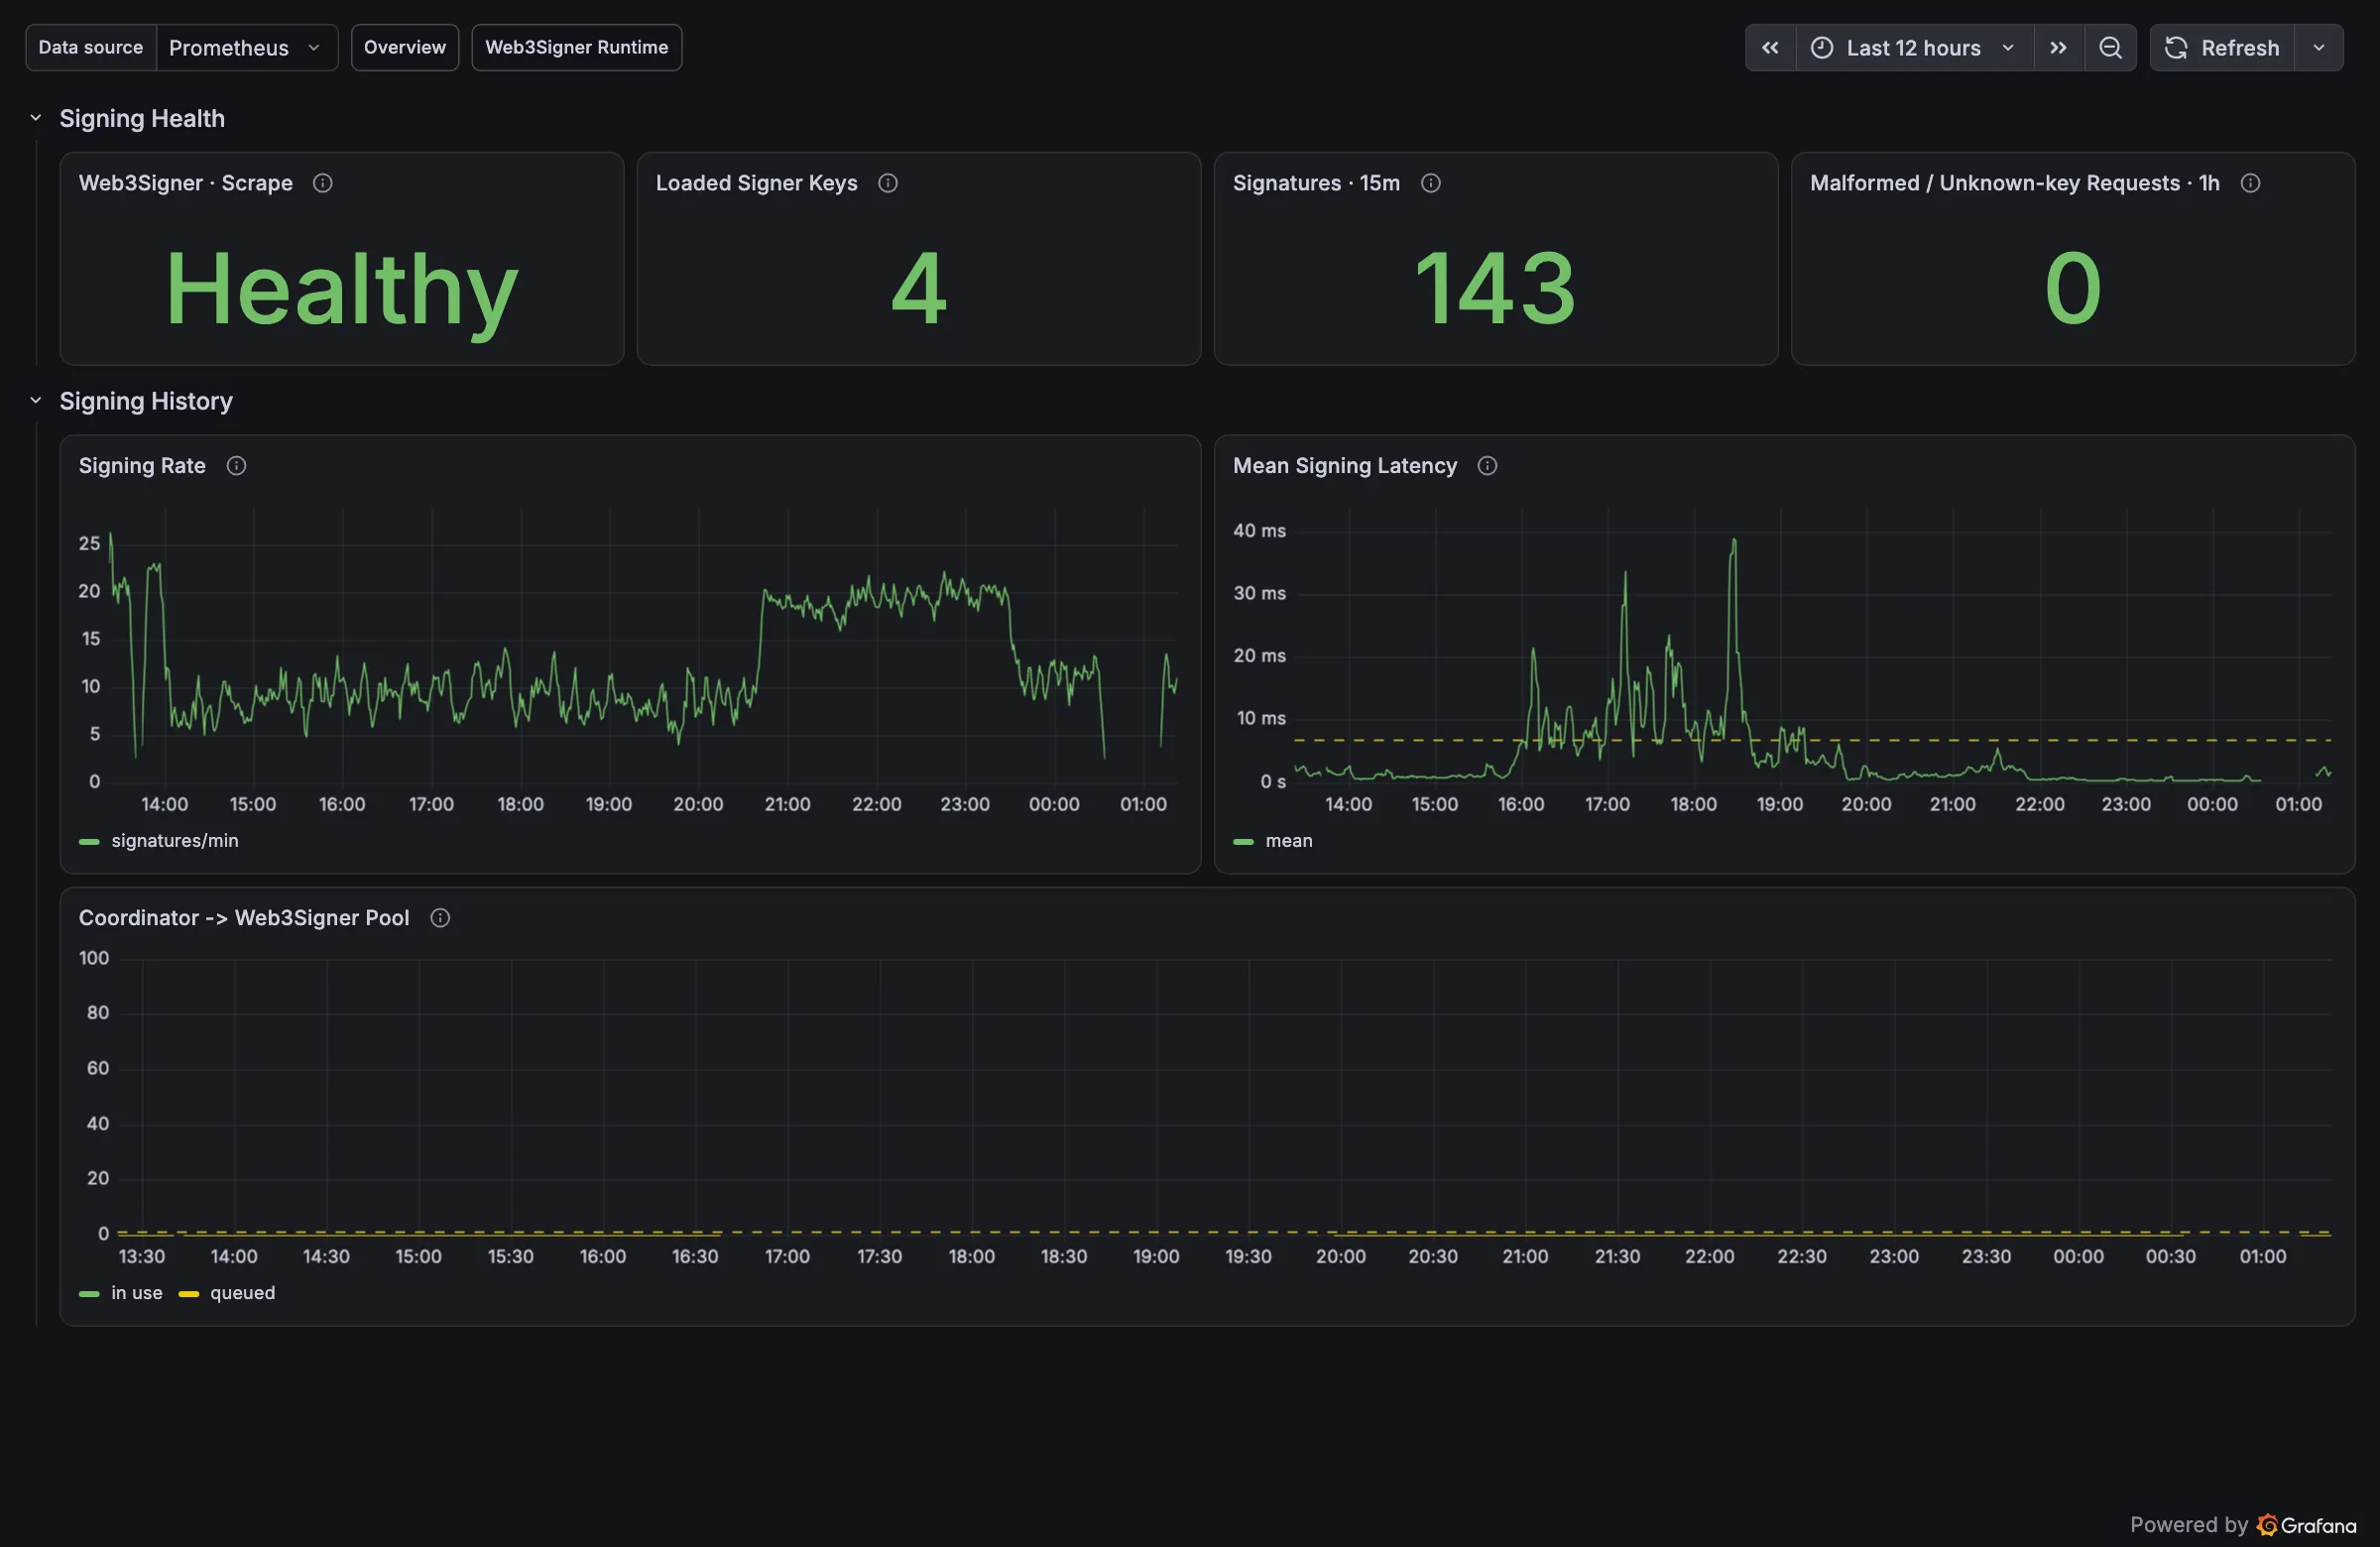
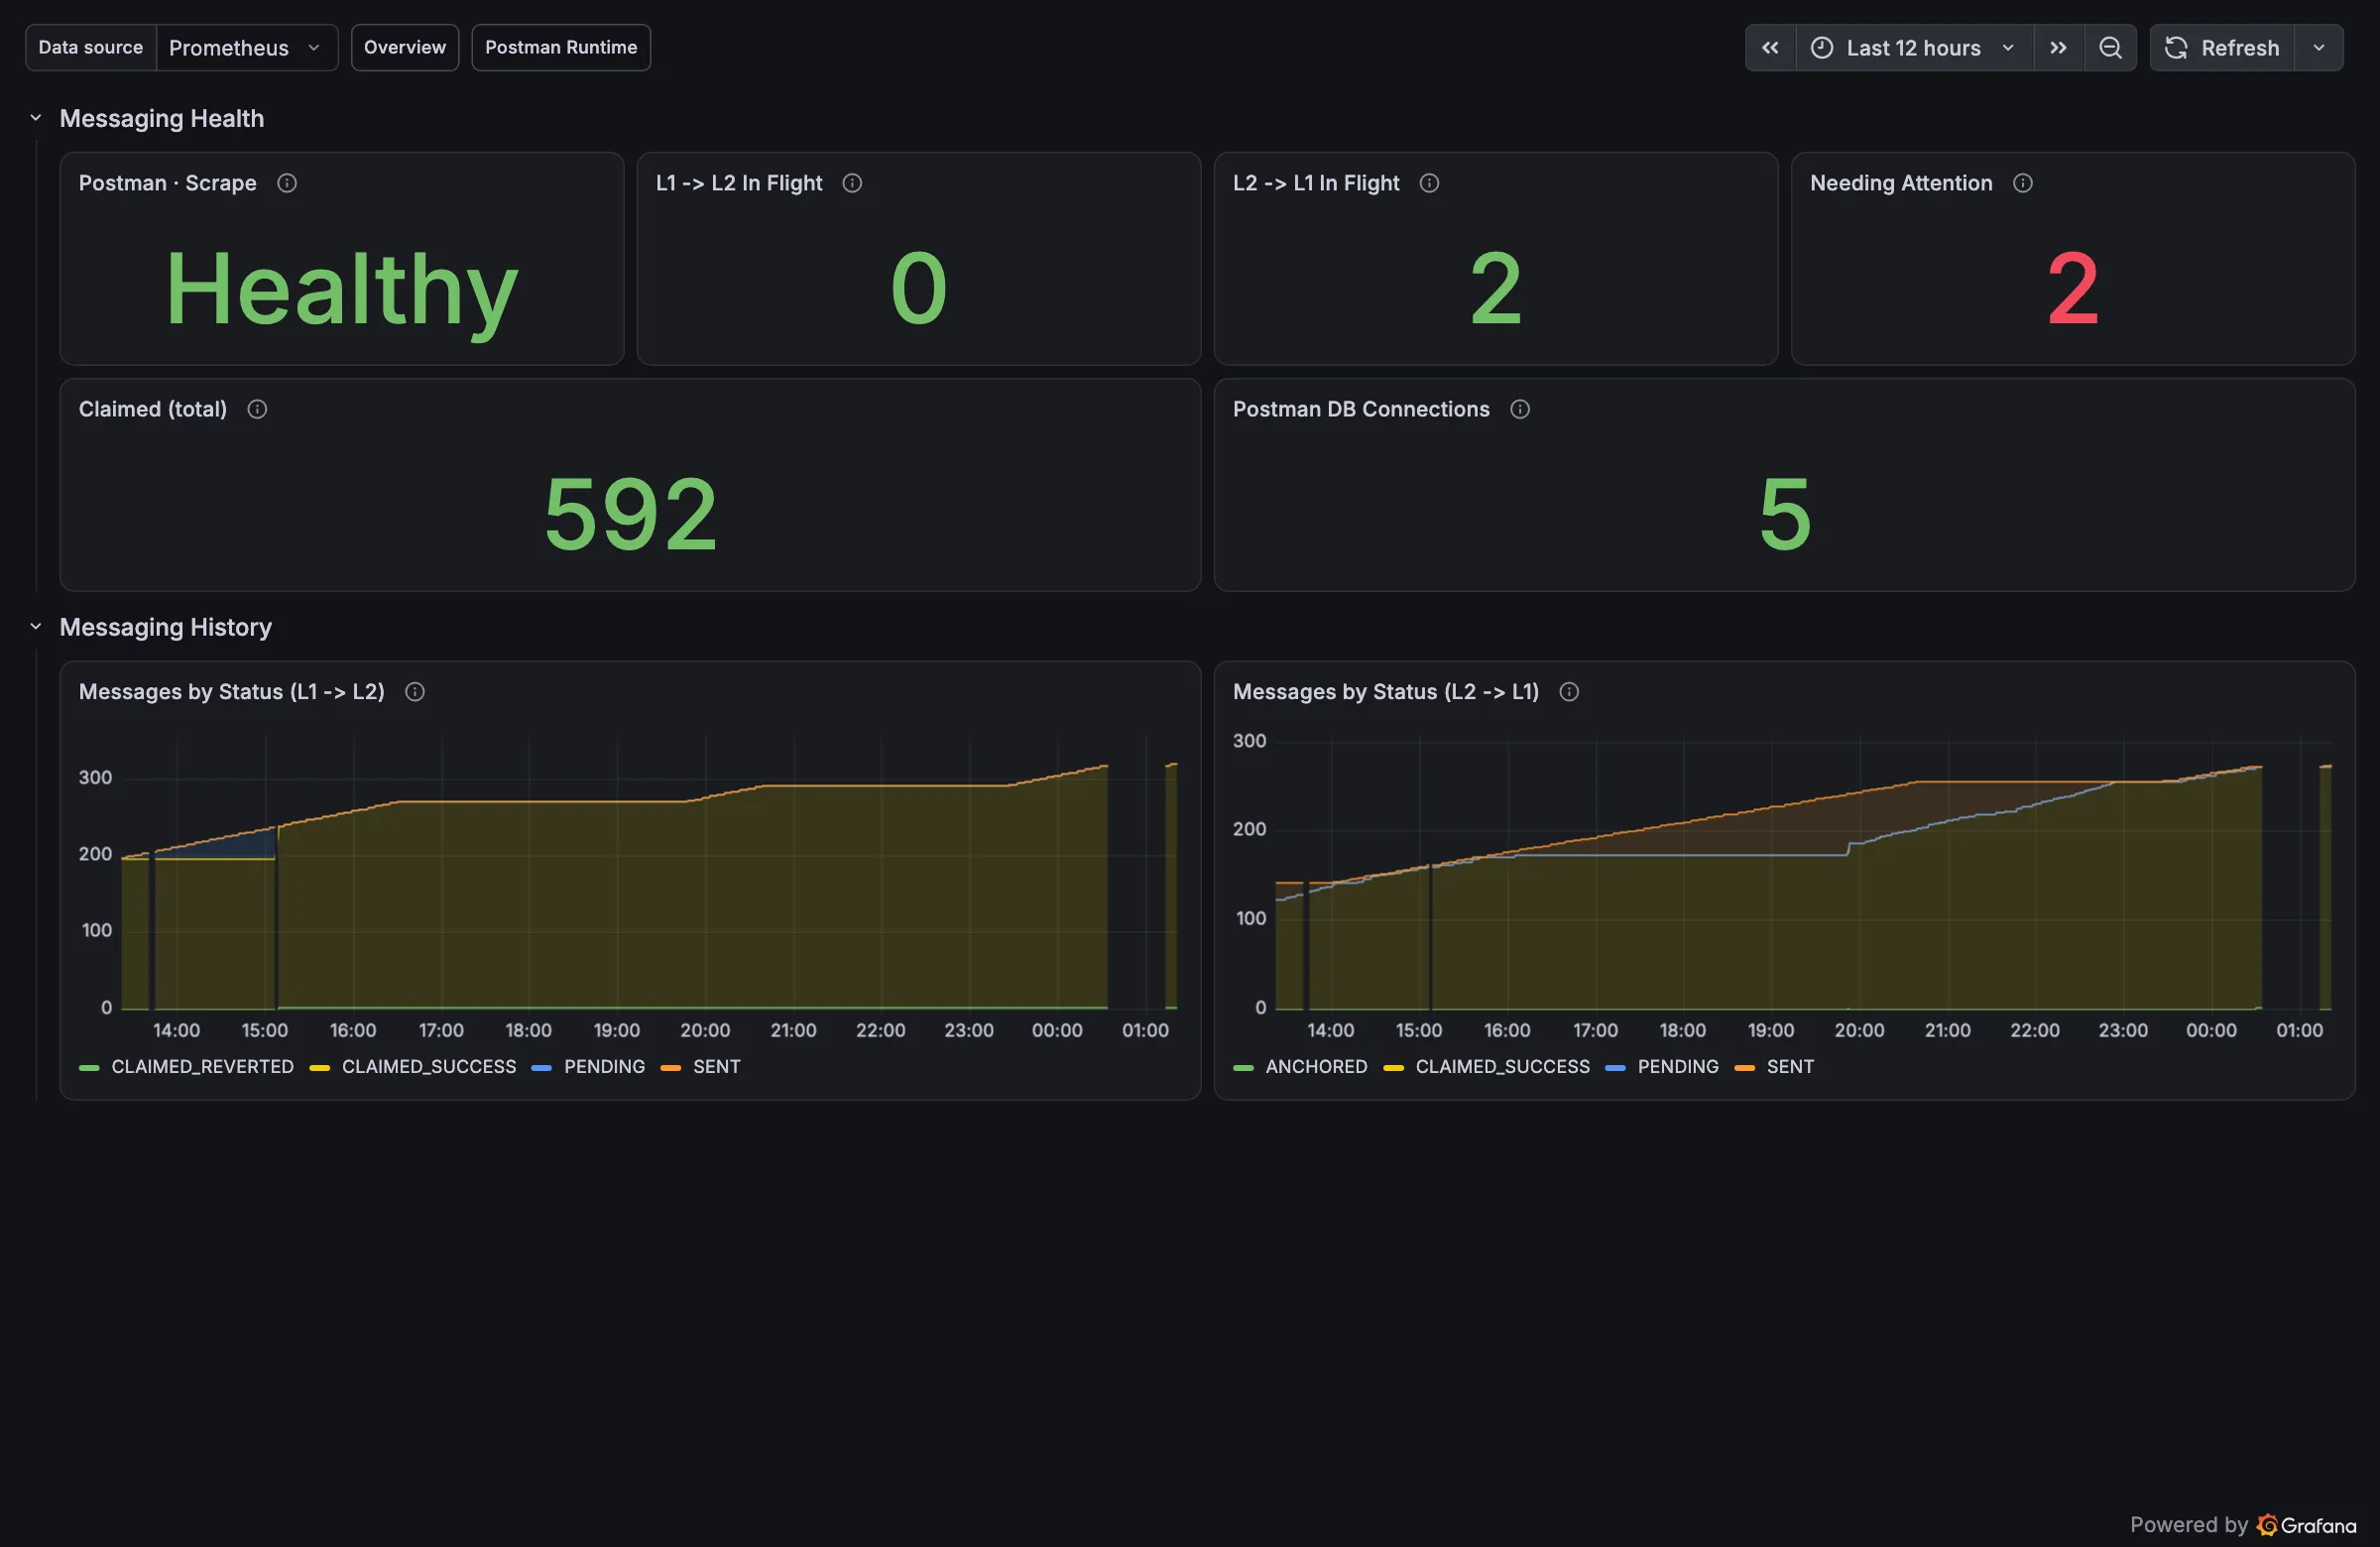
L1 dashboards
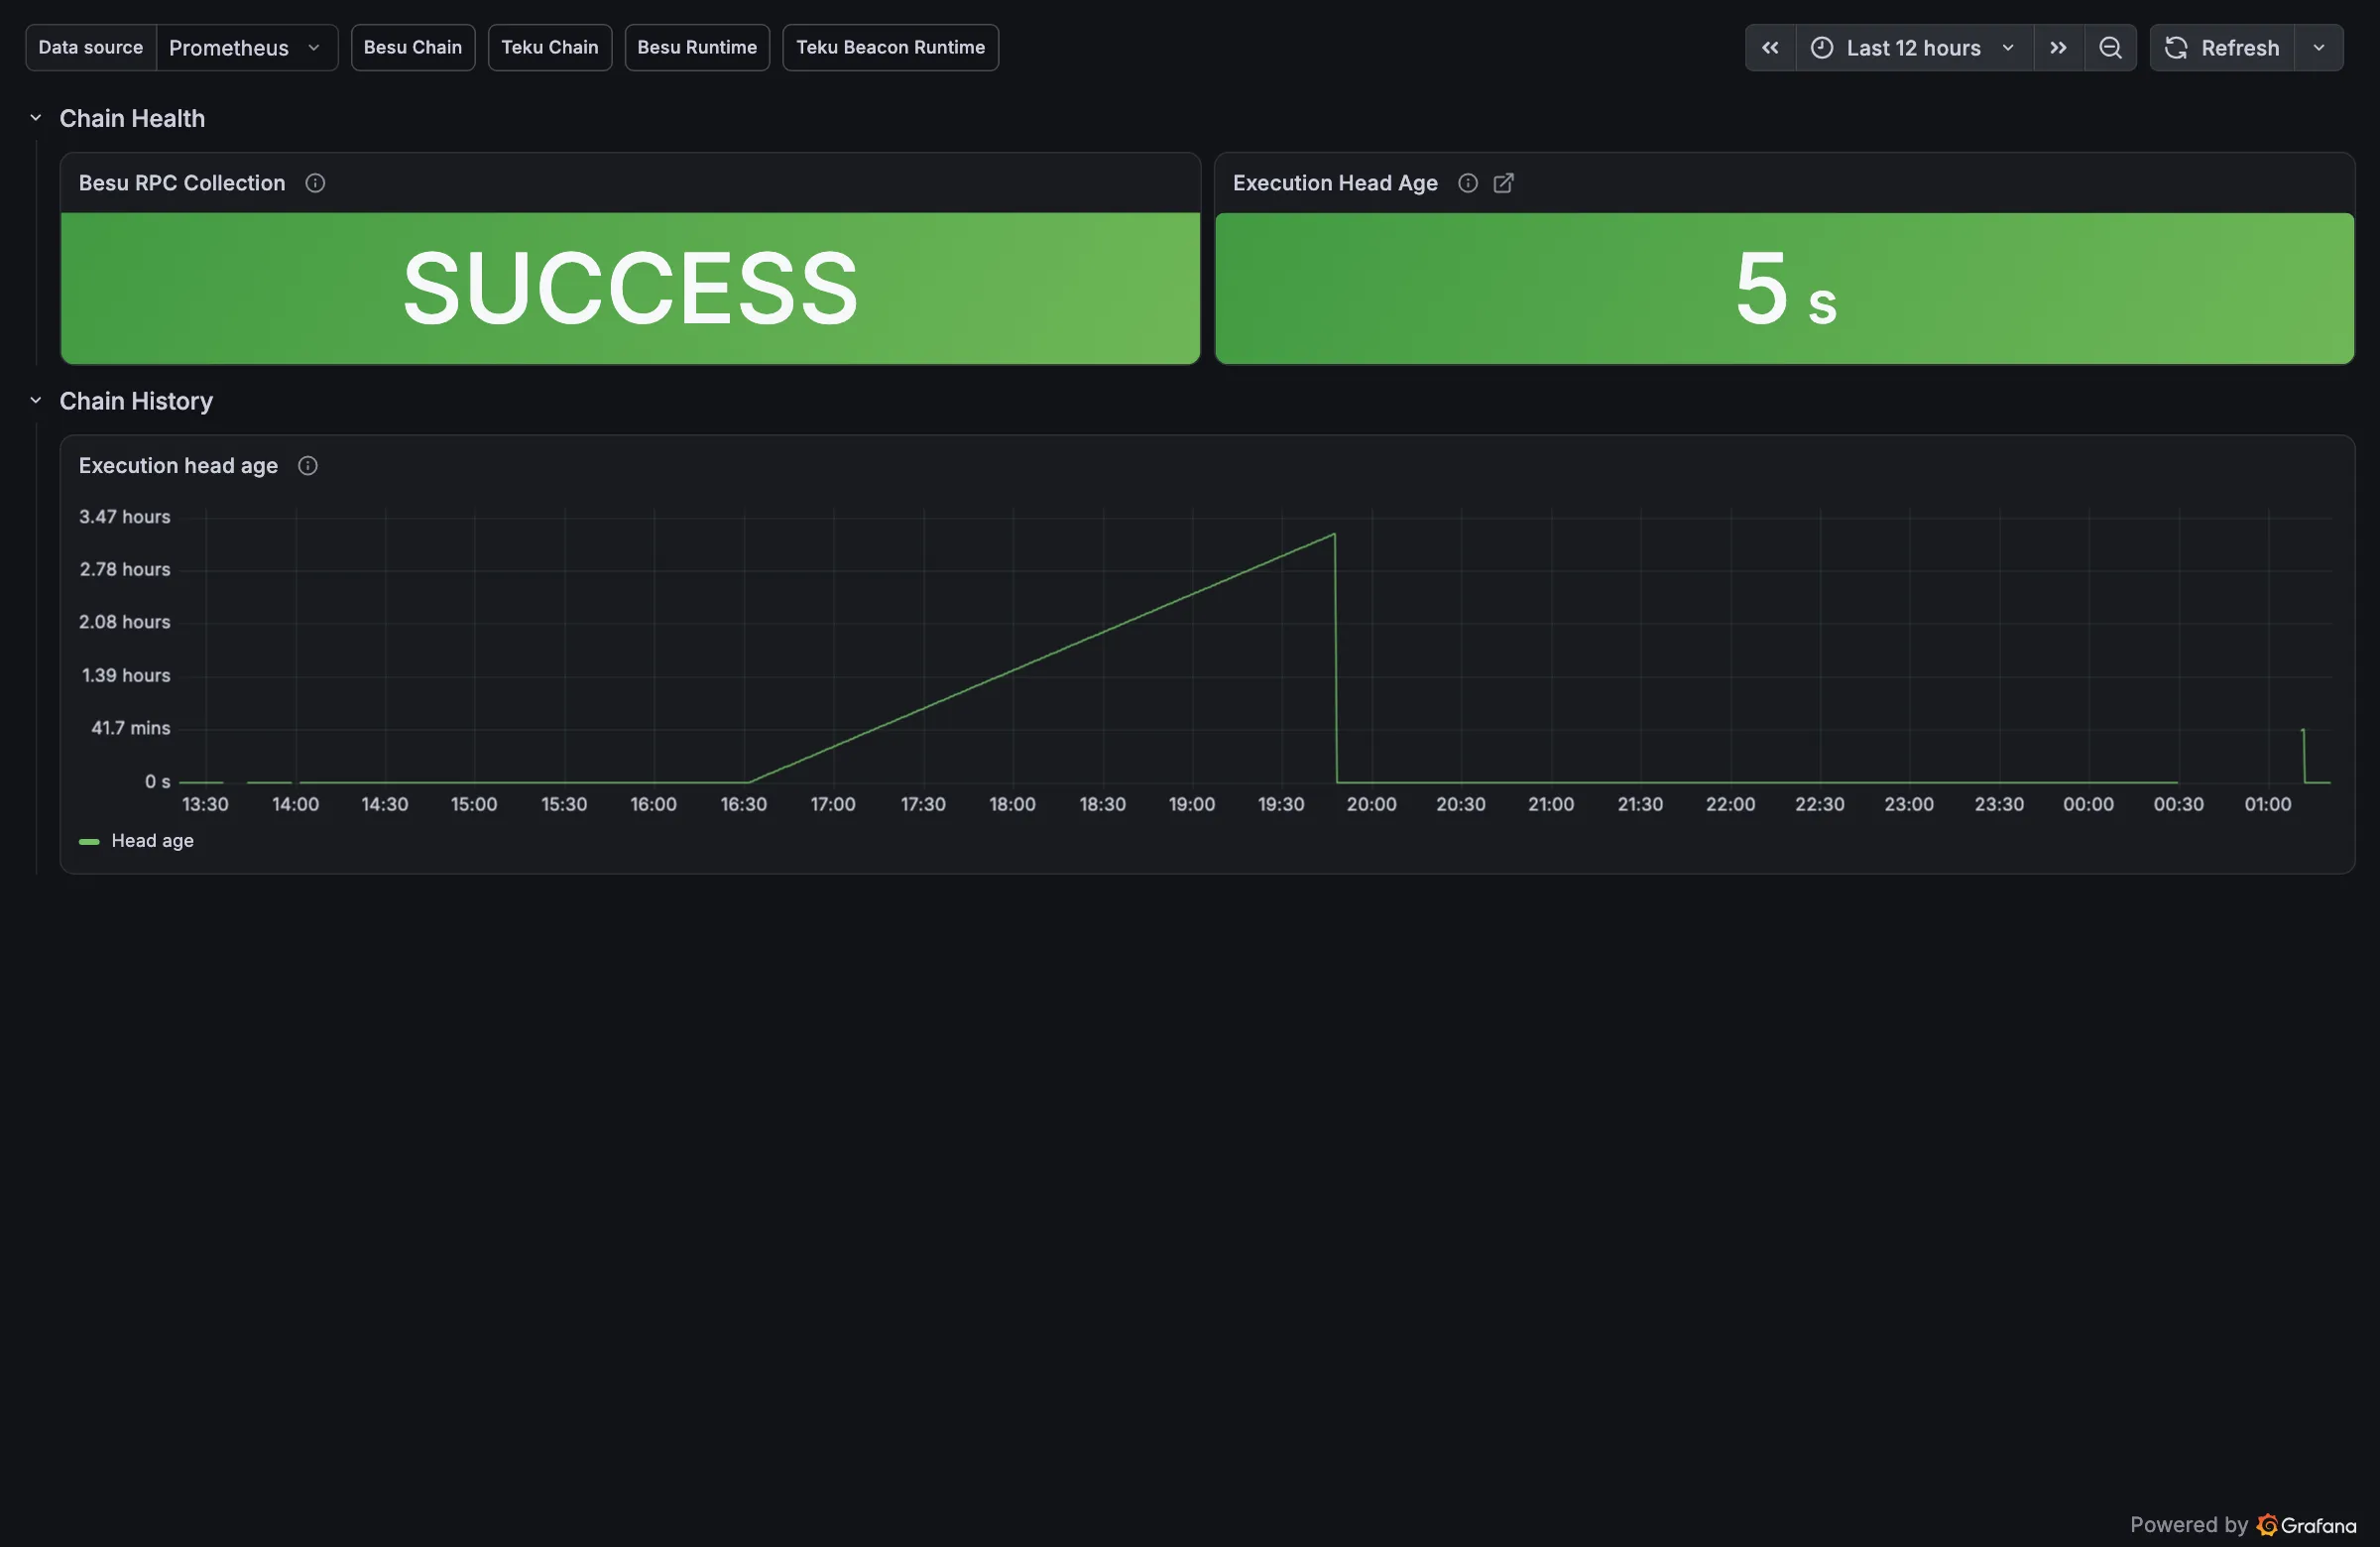
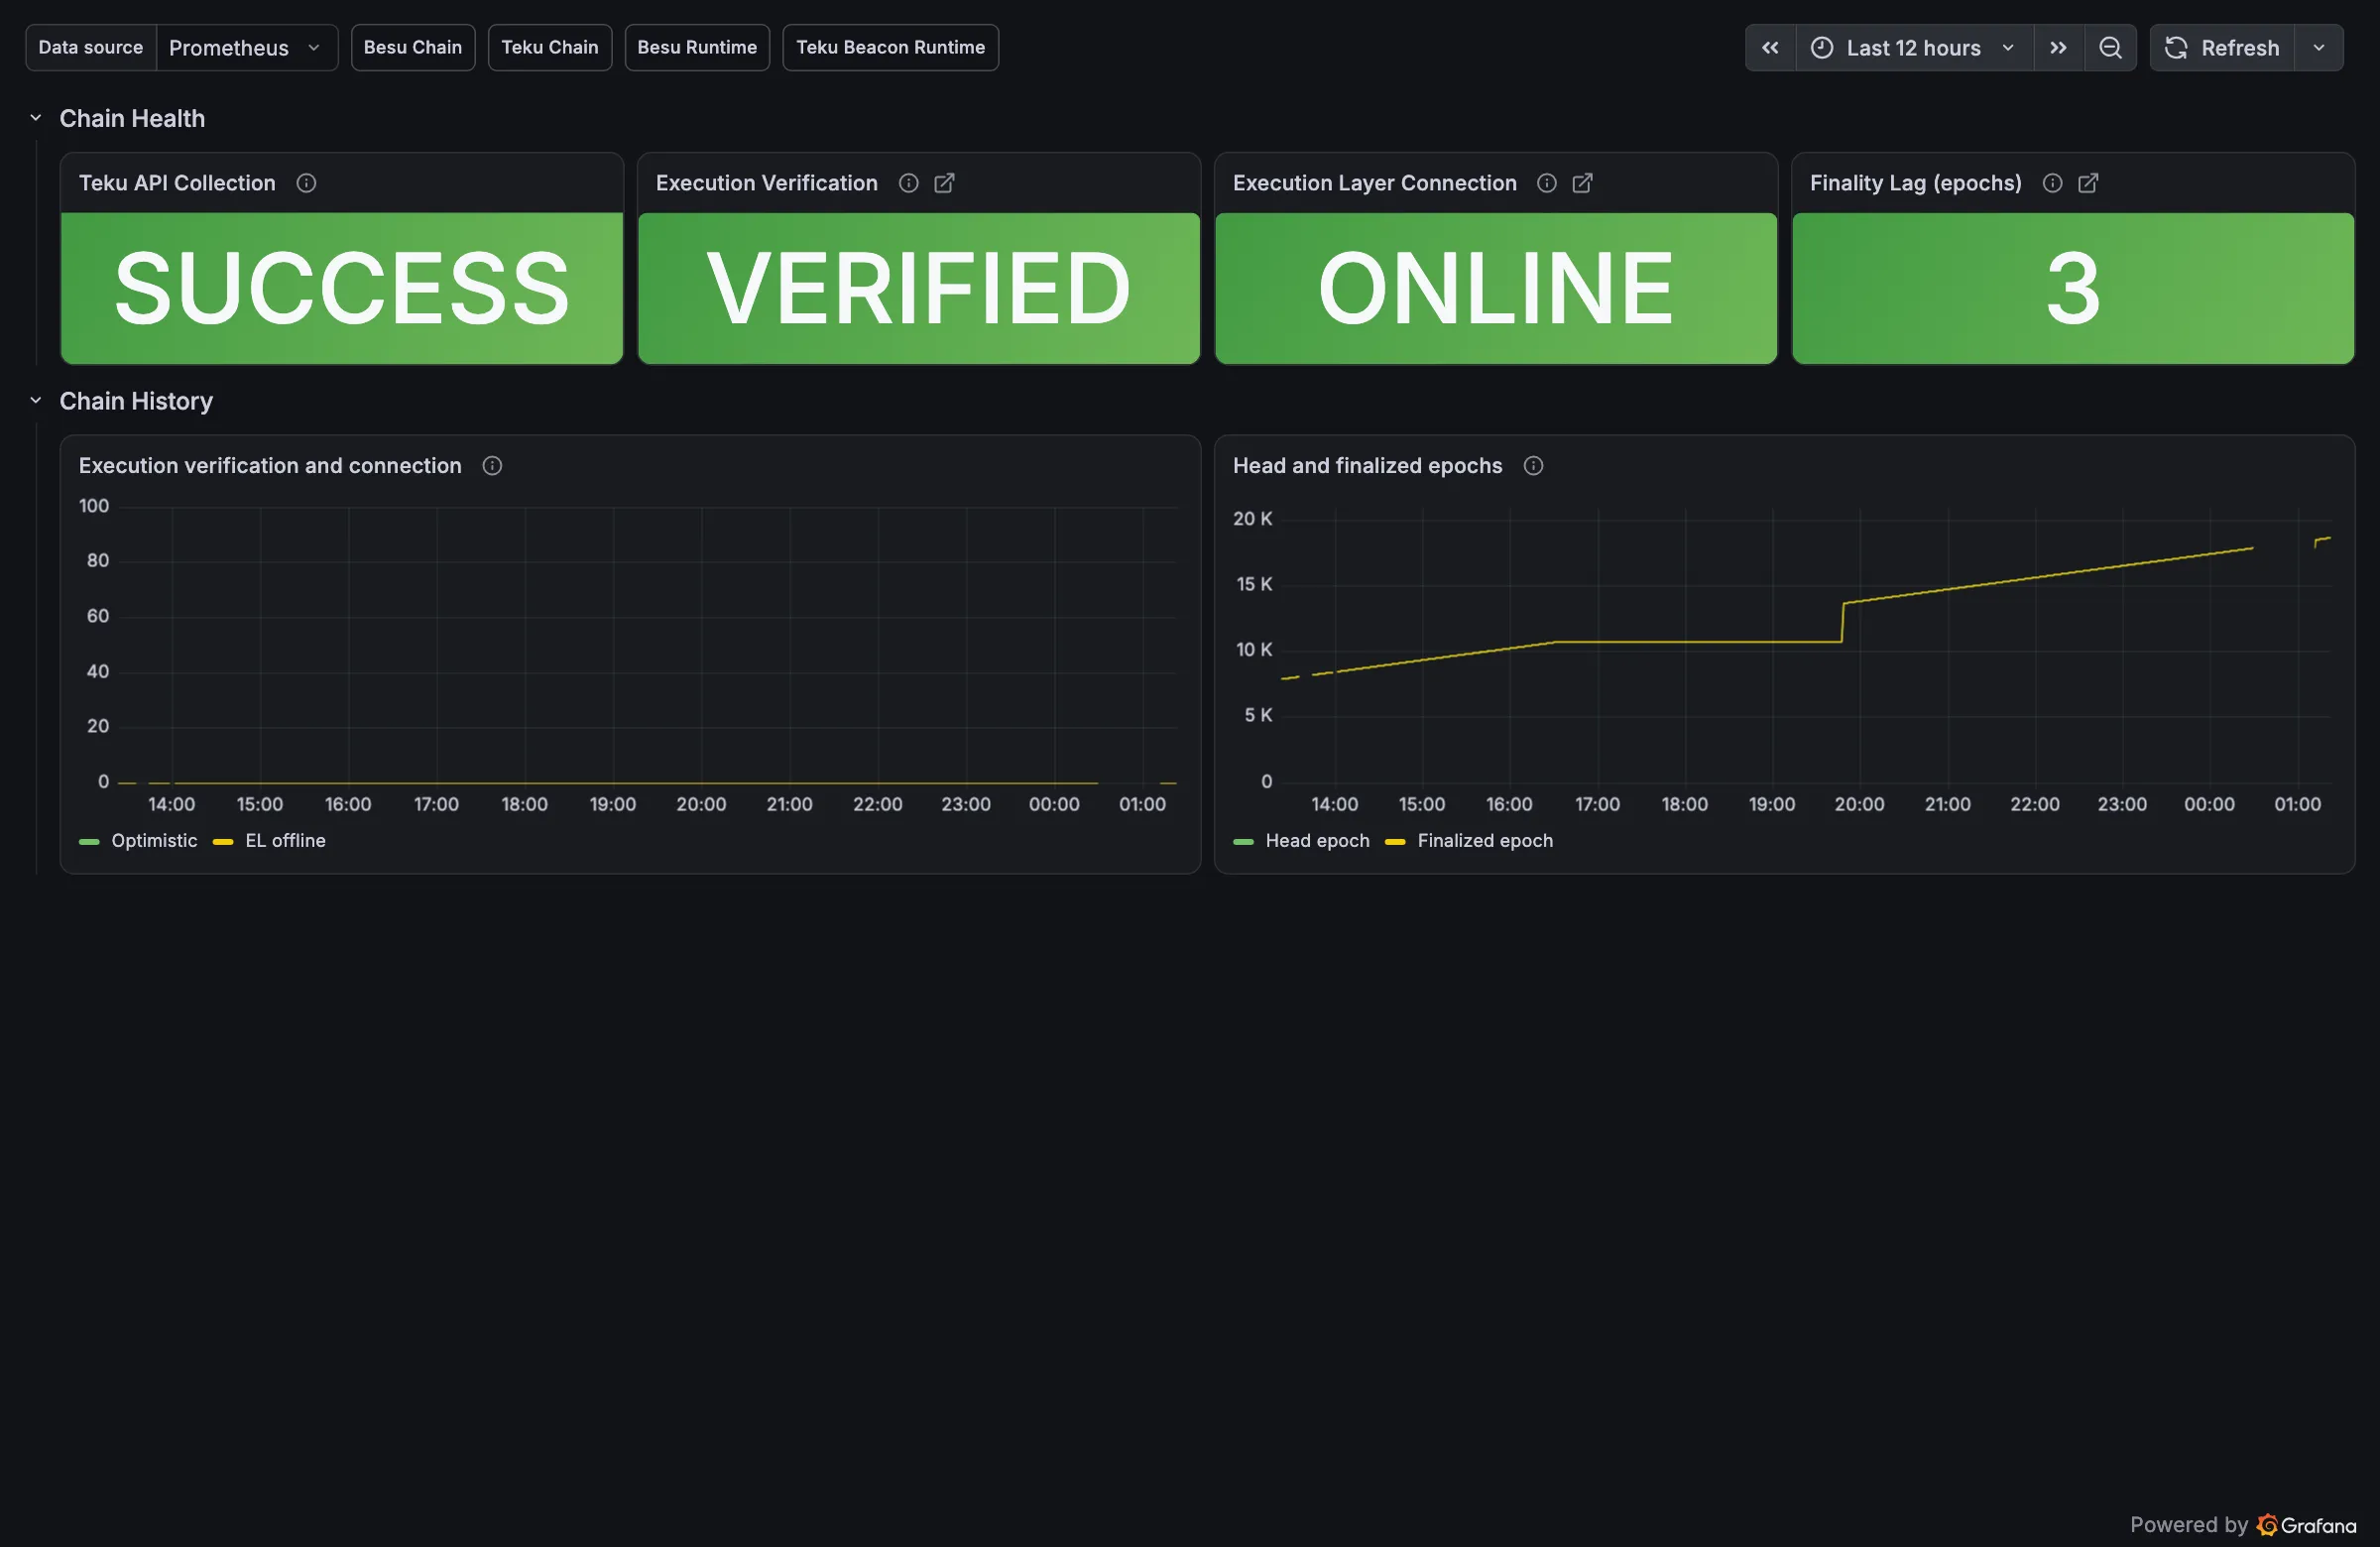
Runtime dashboards
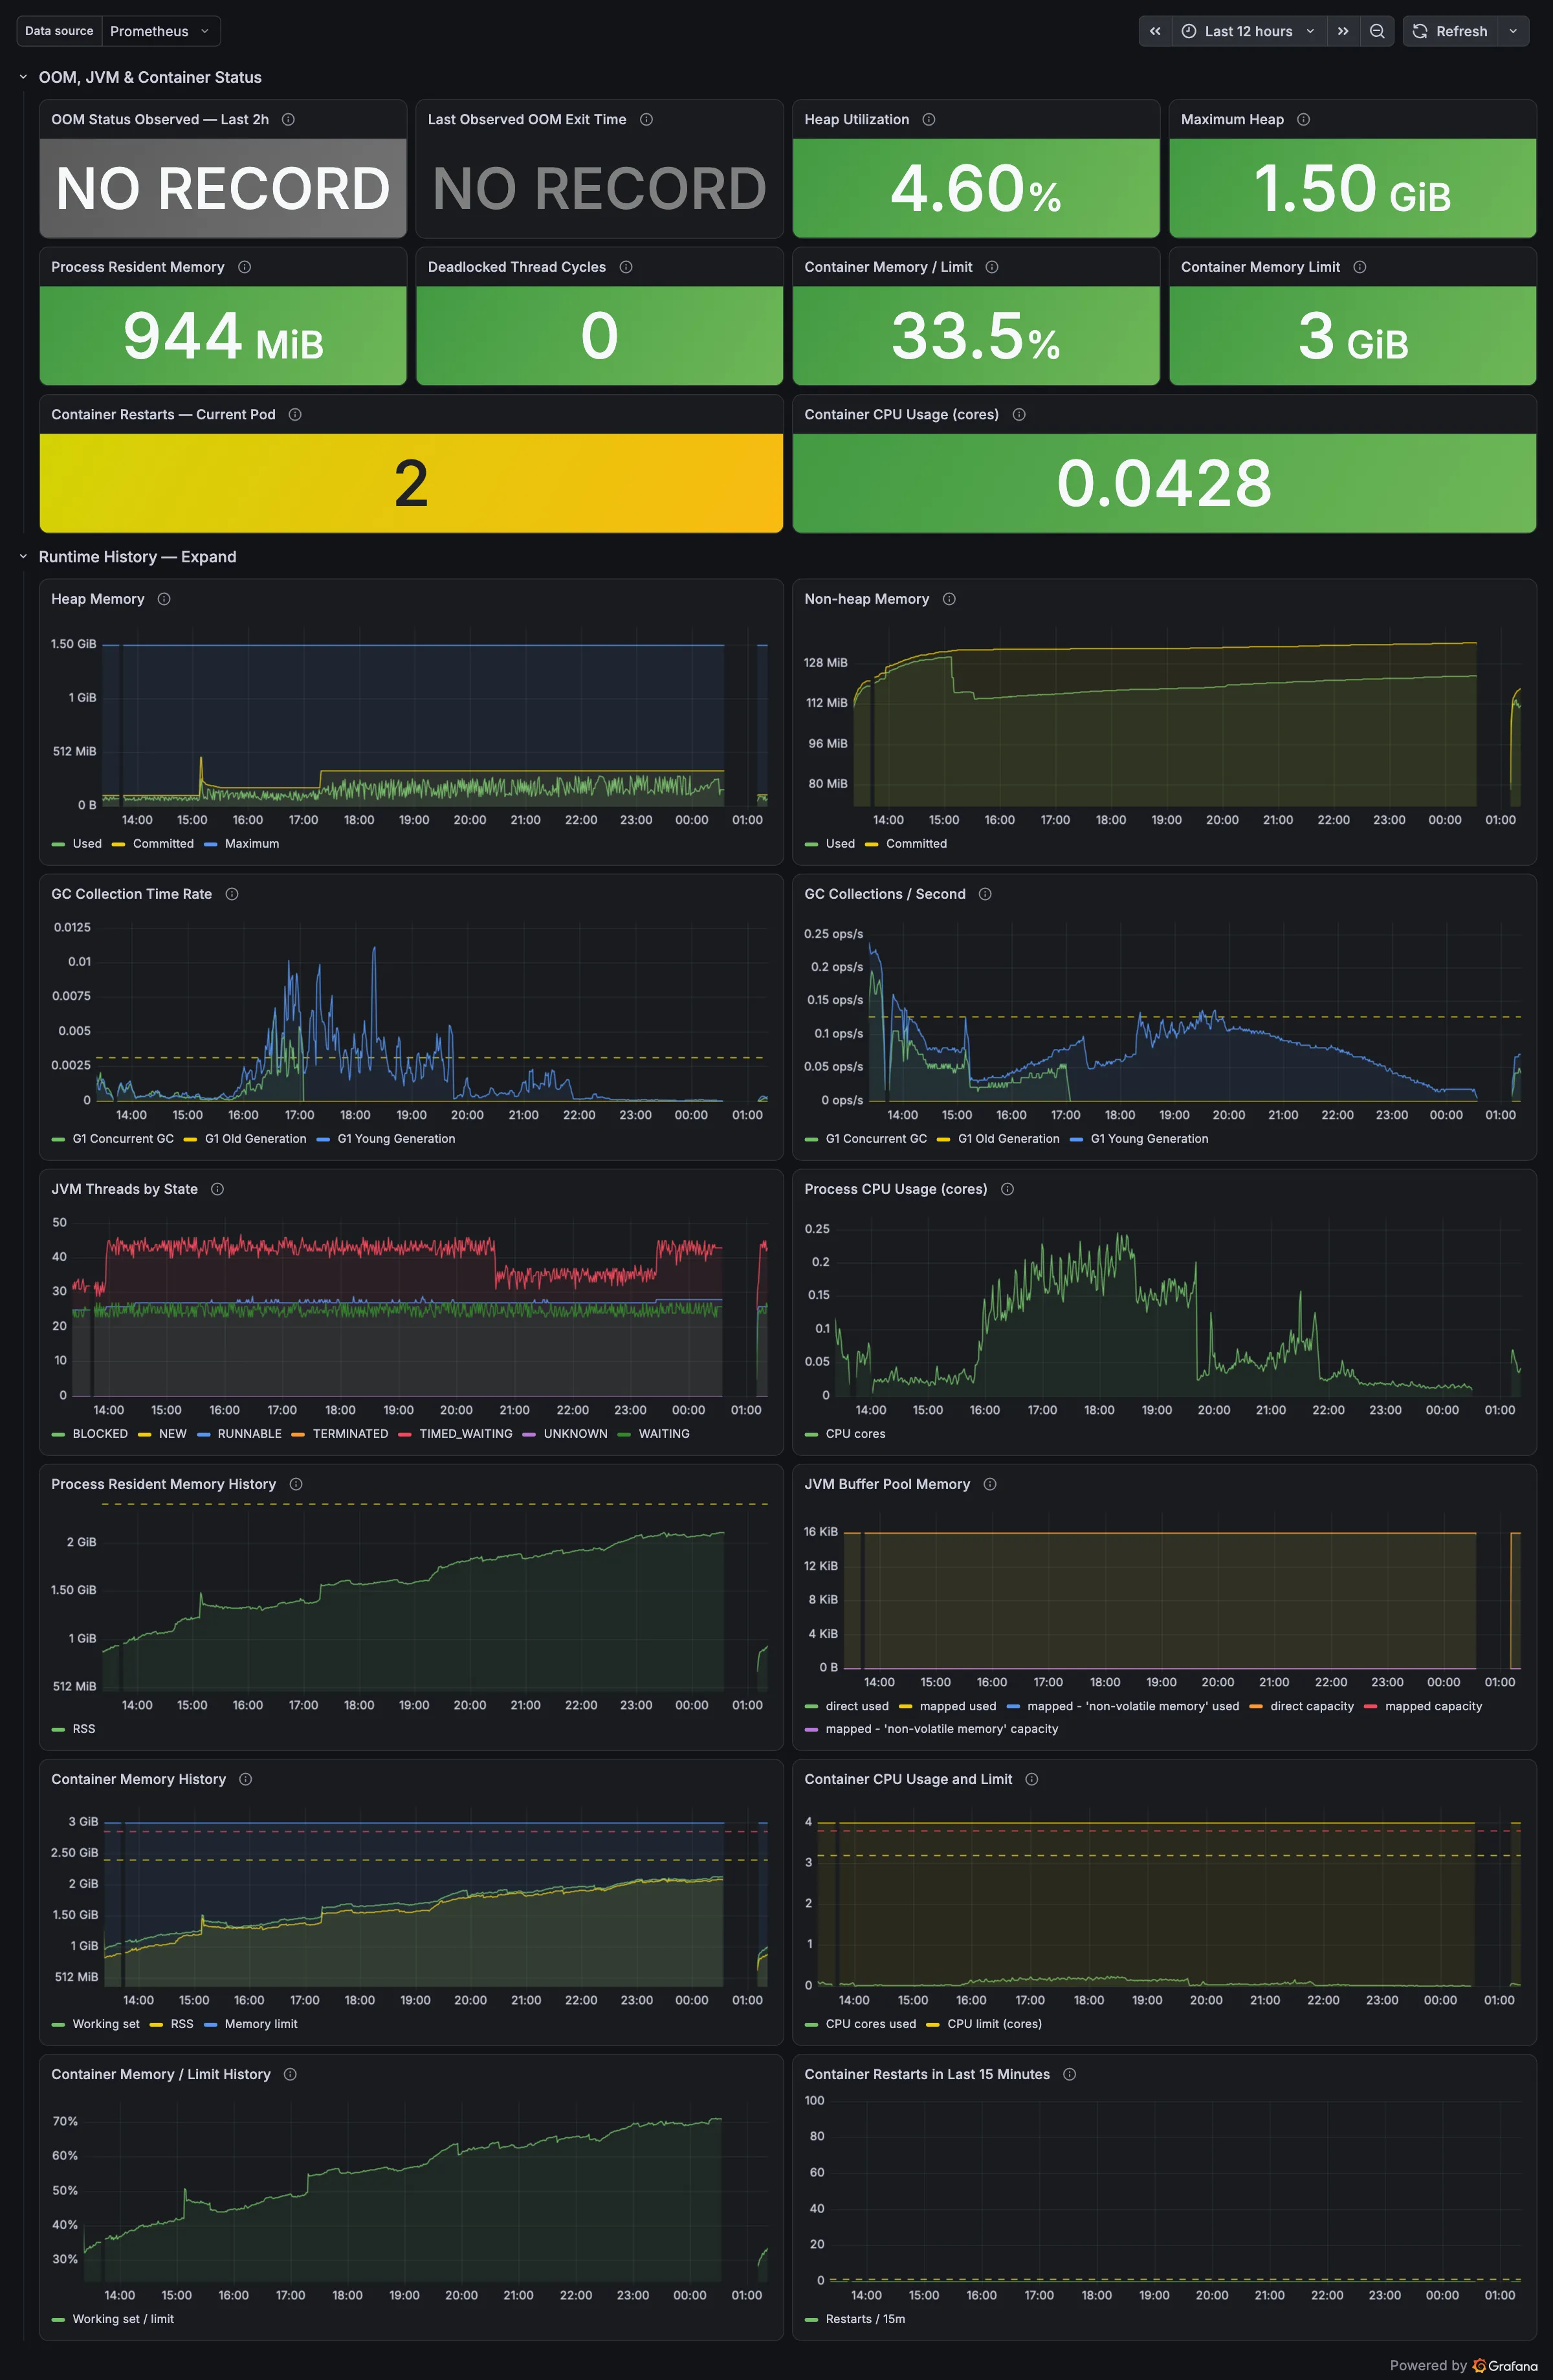
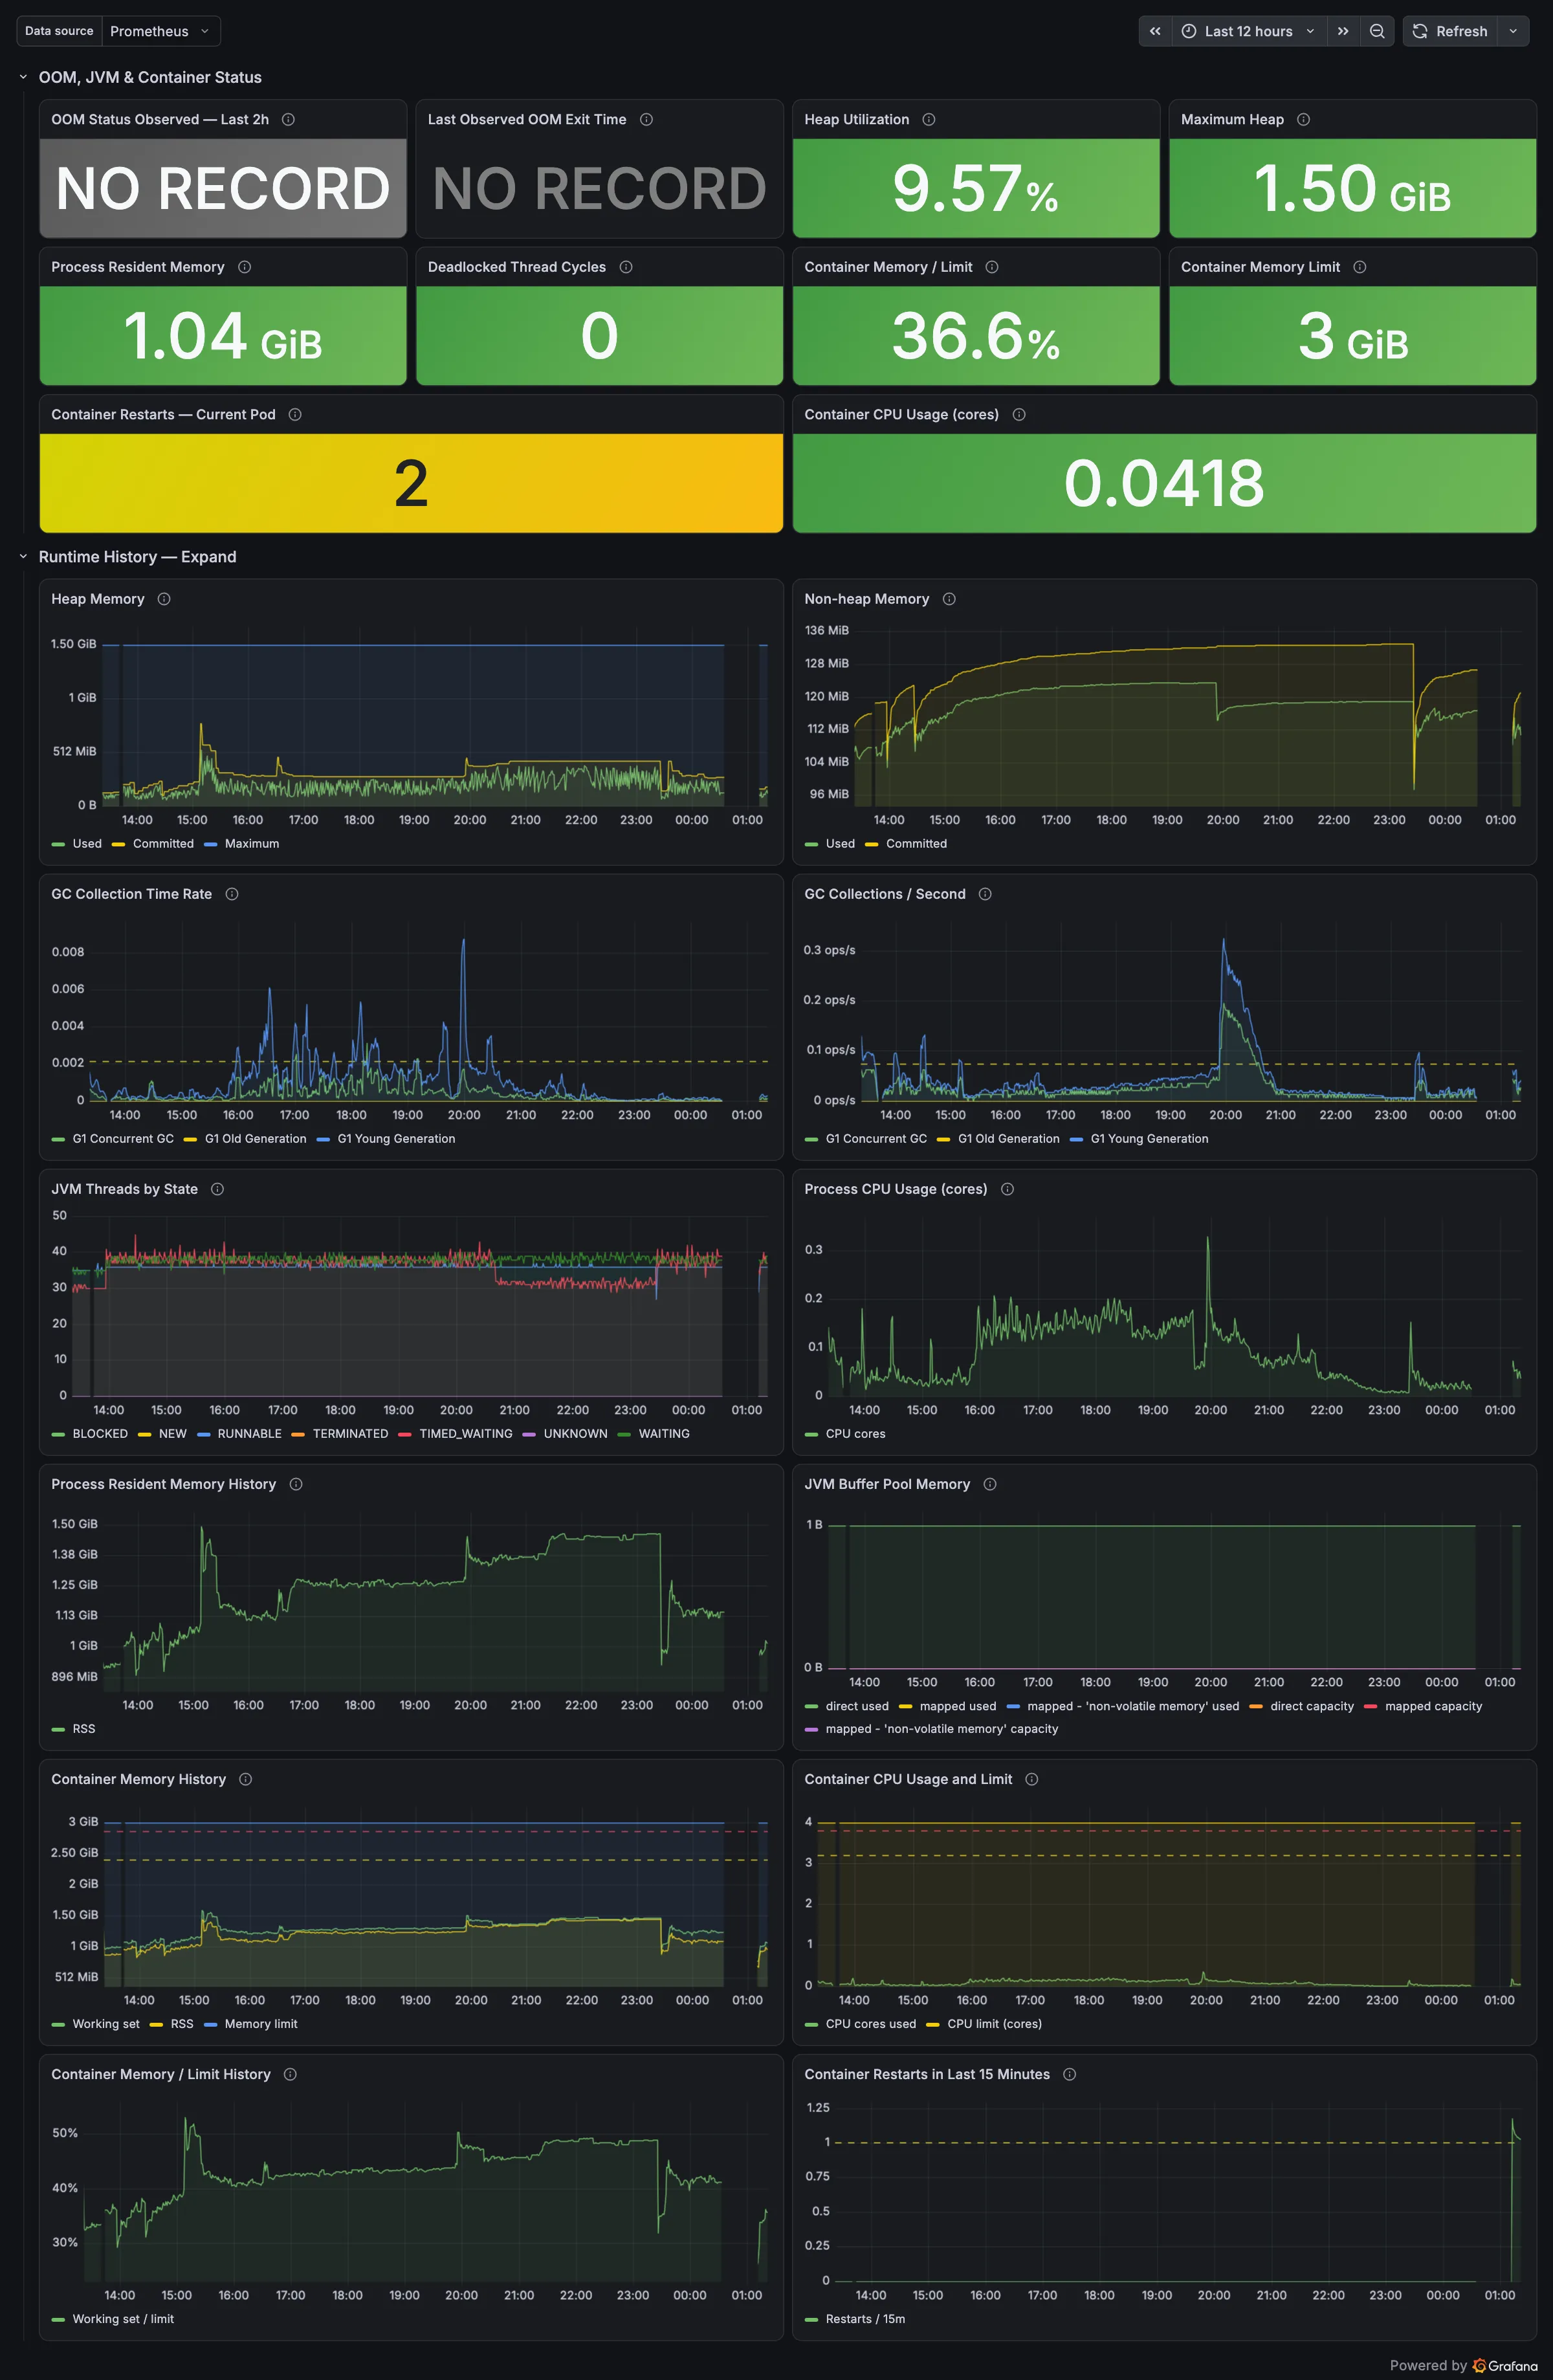
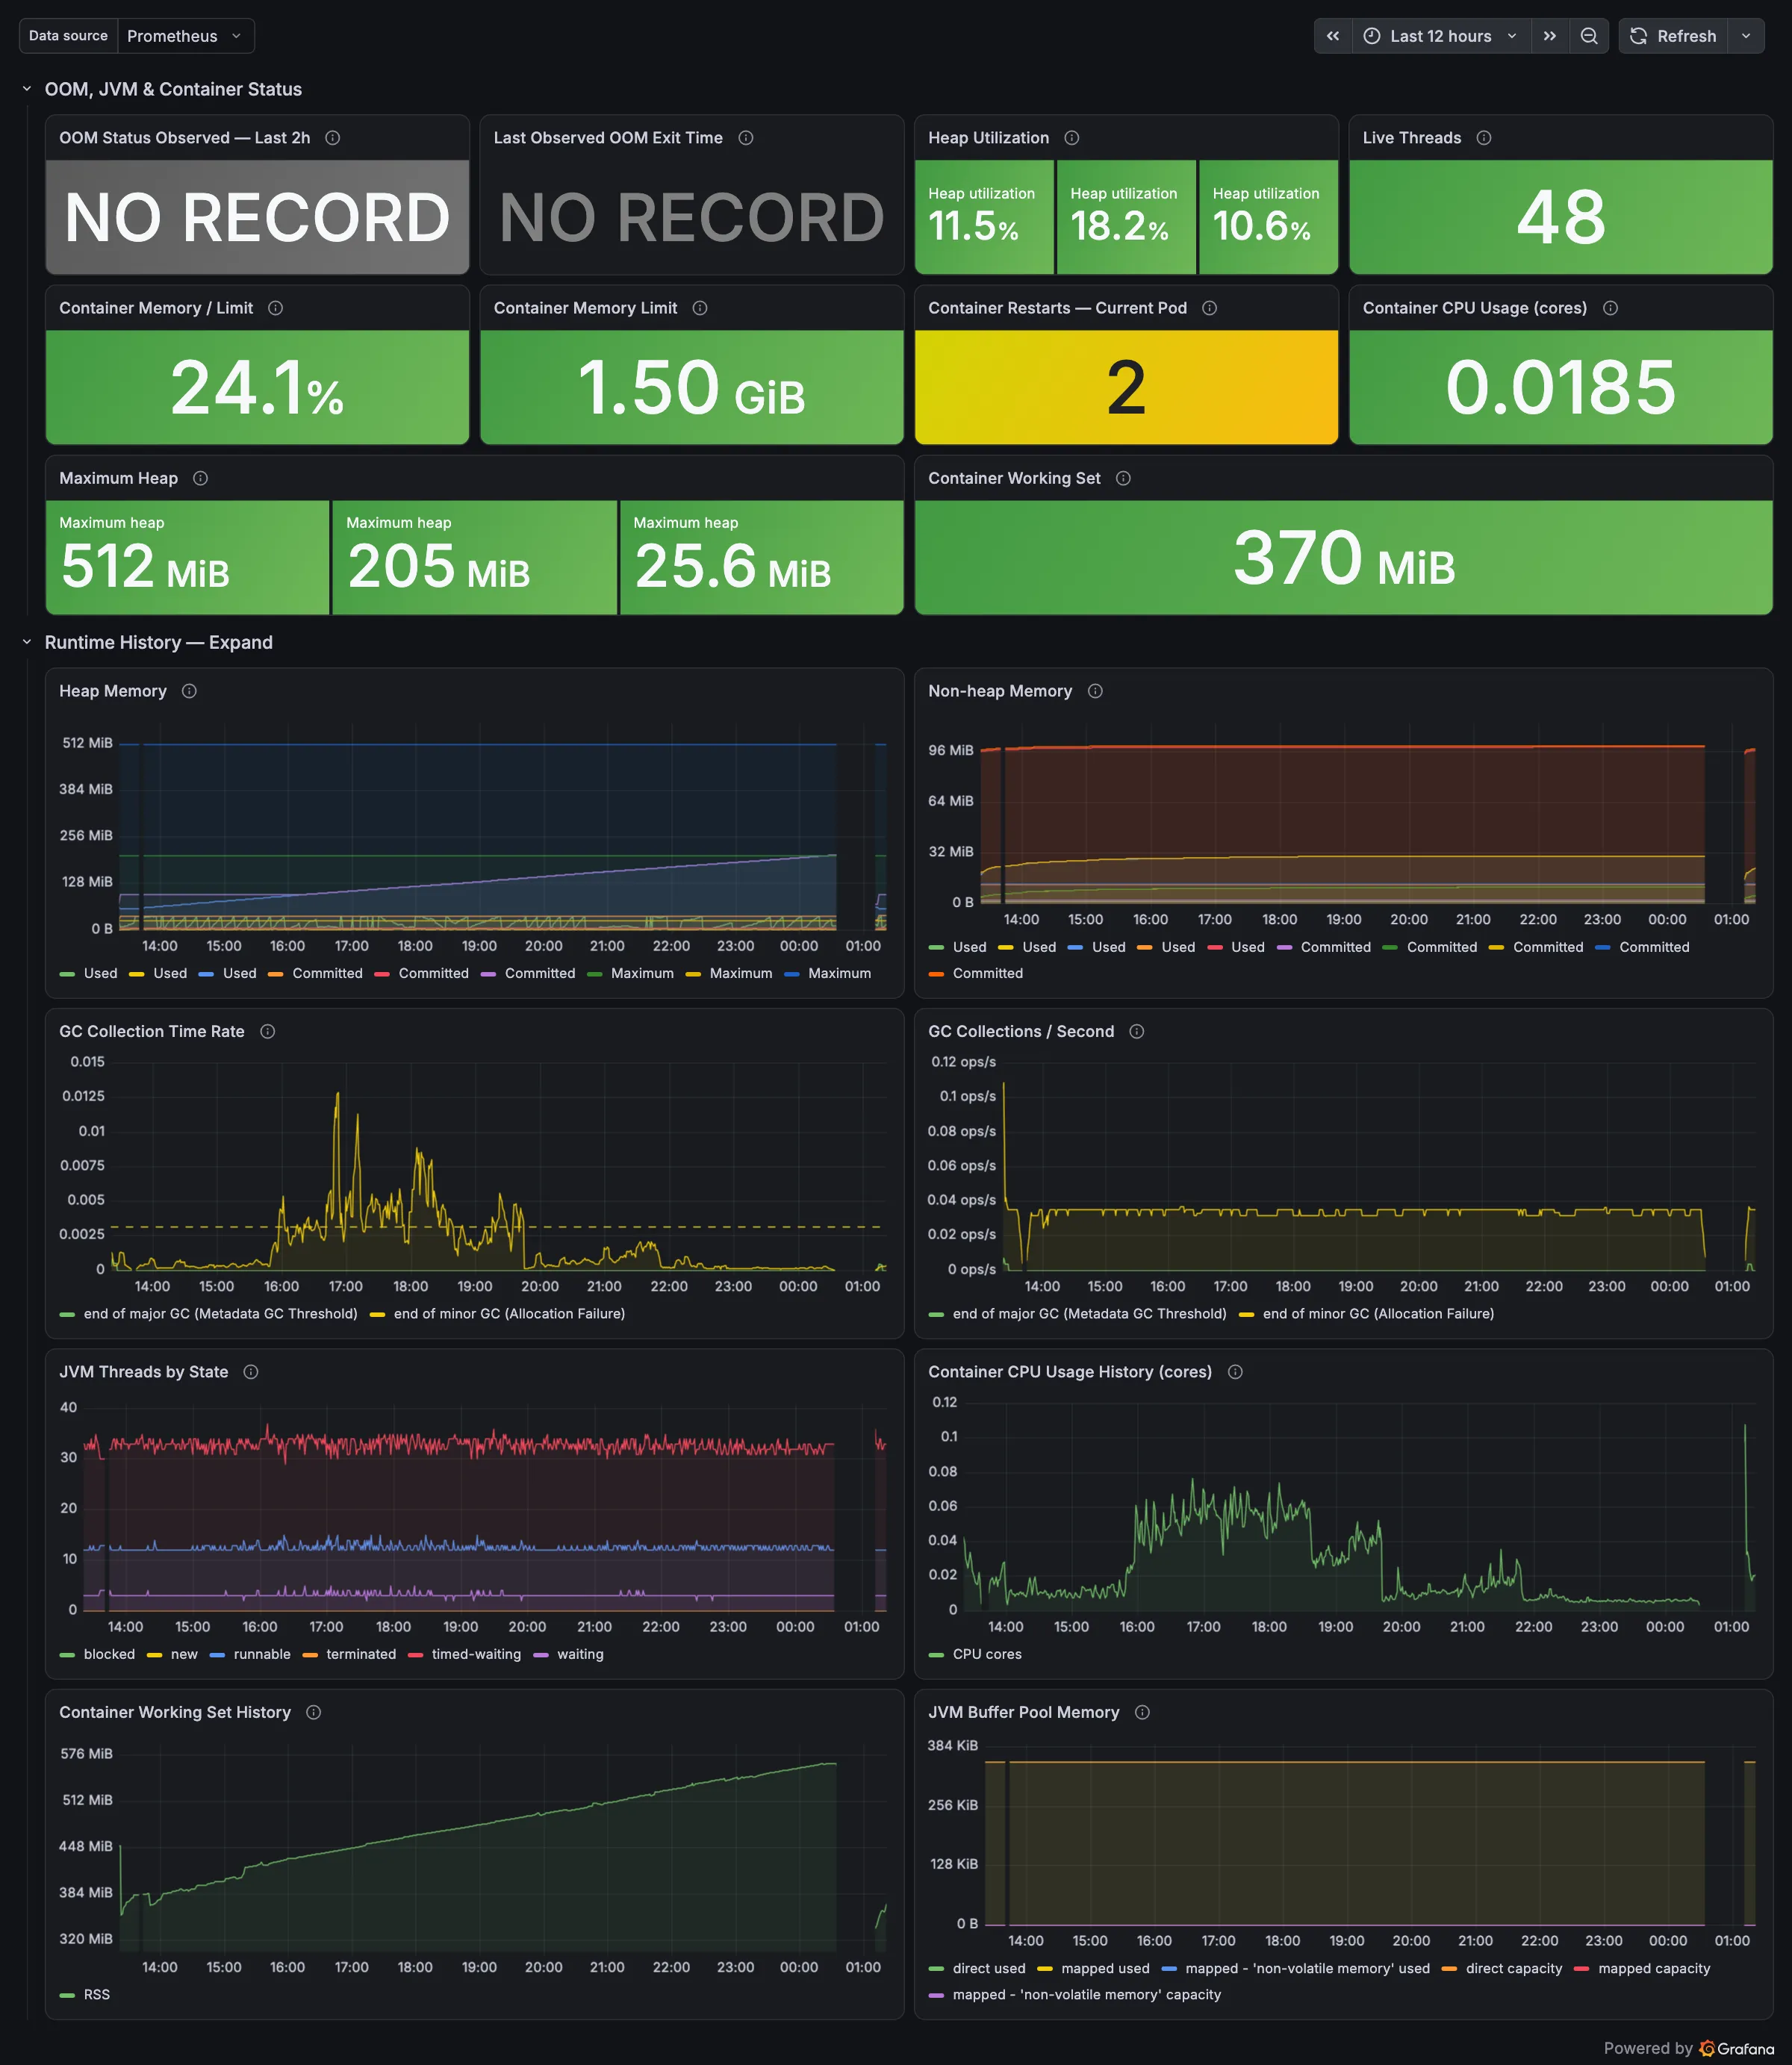
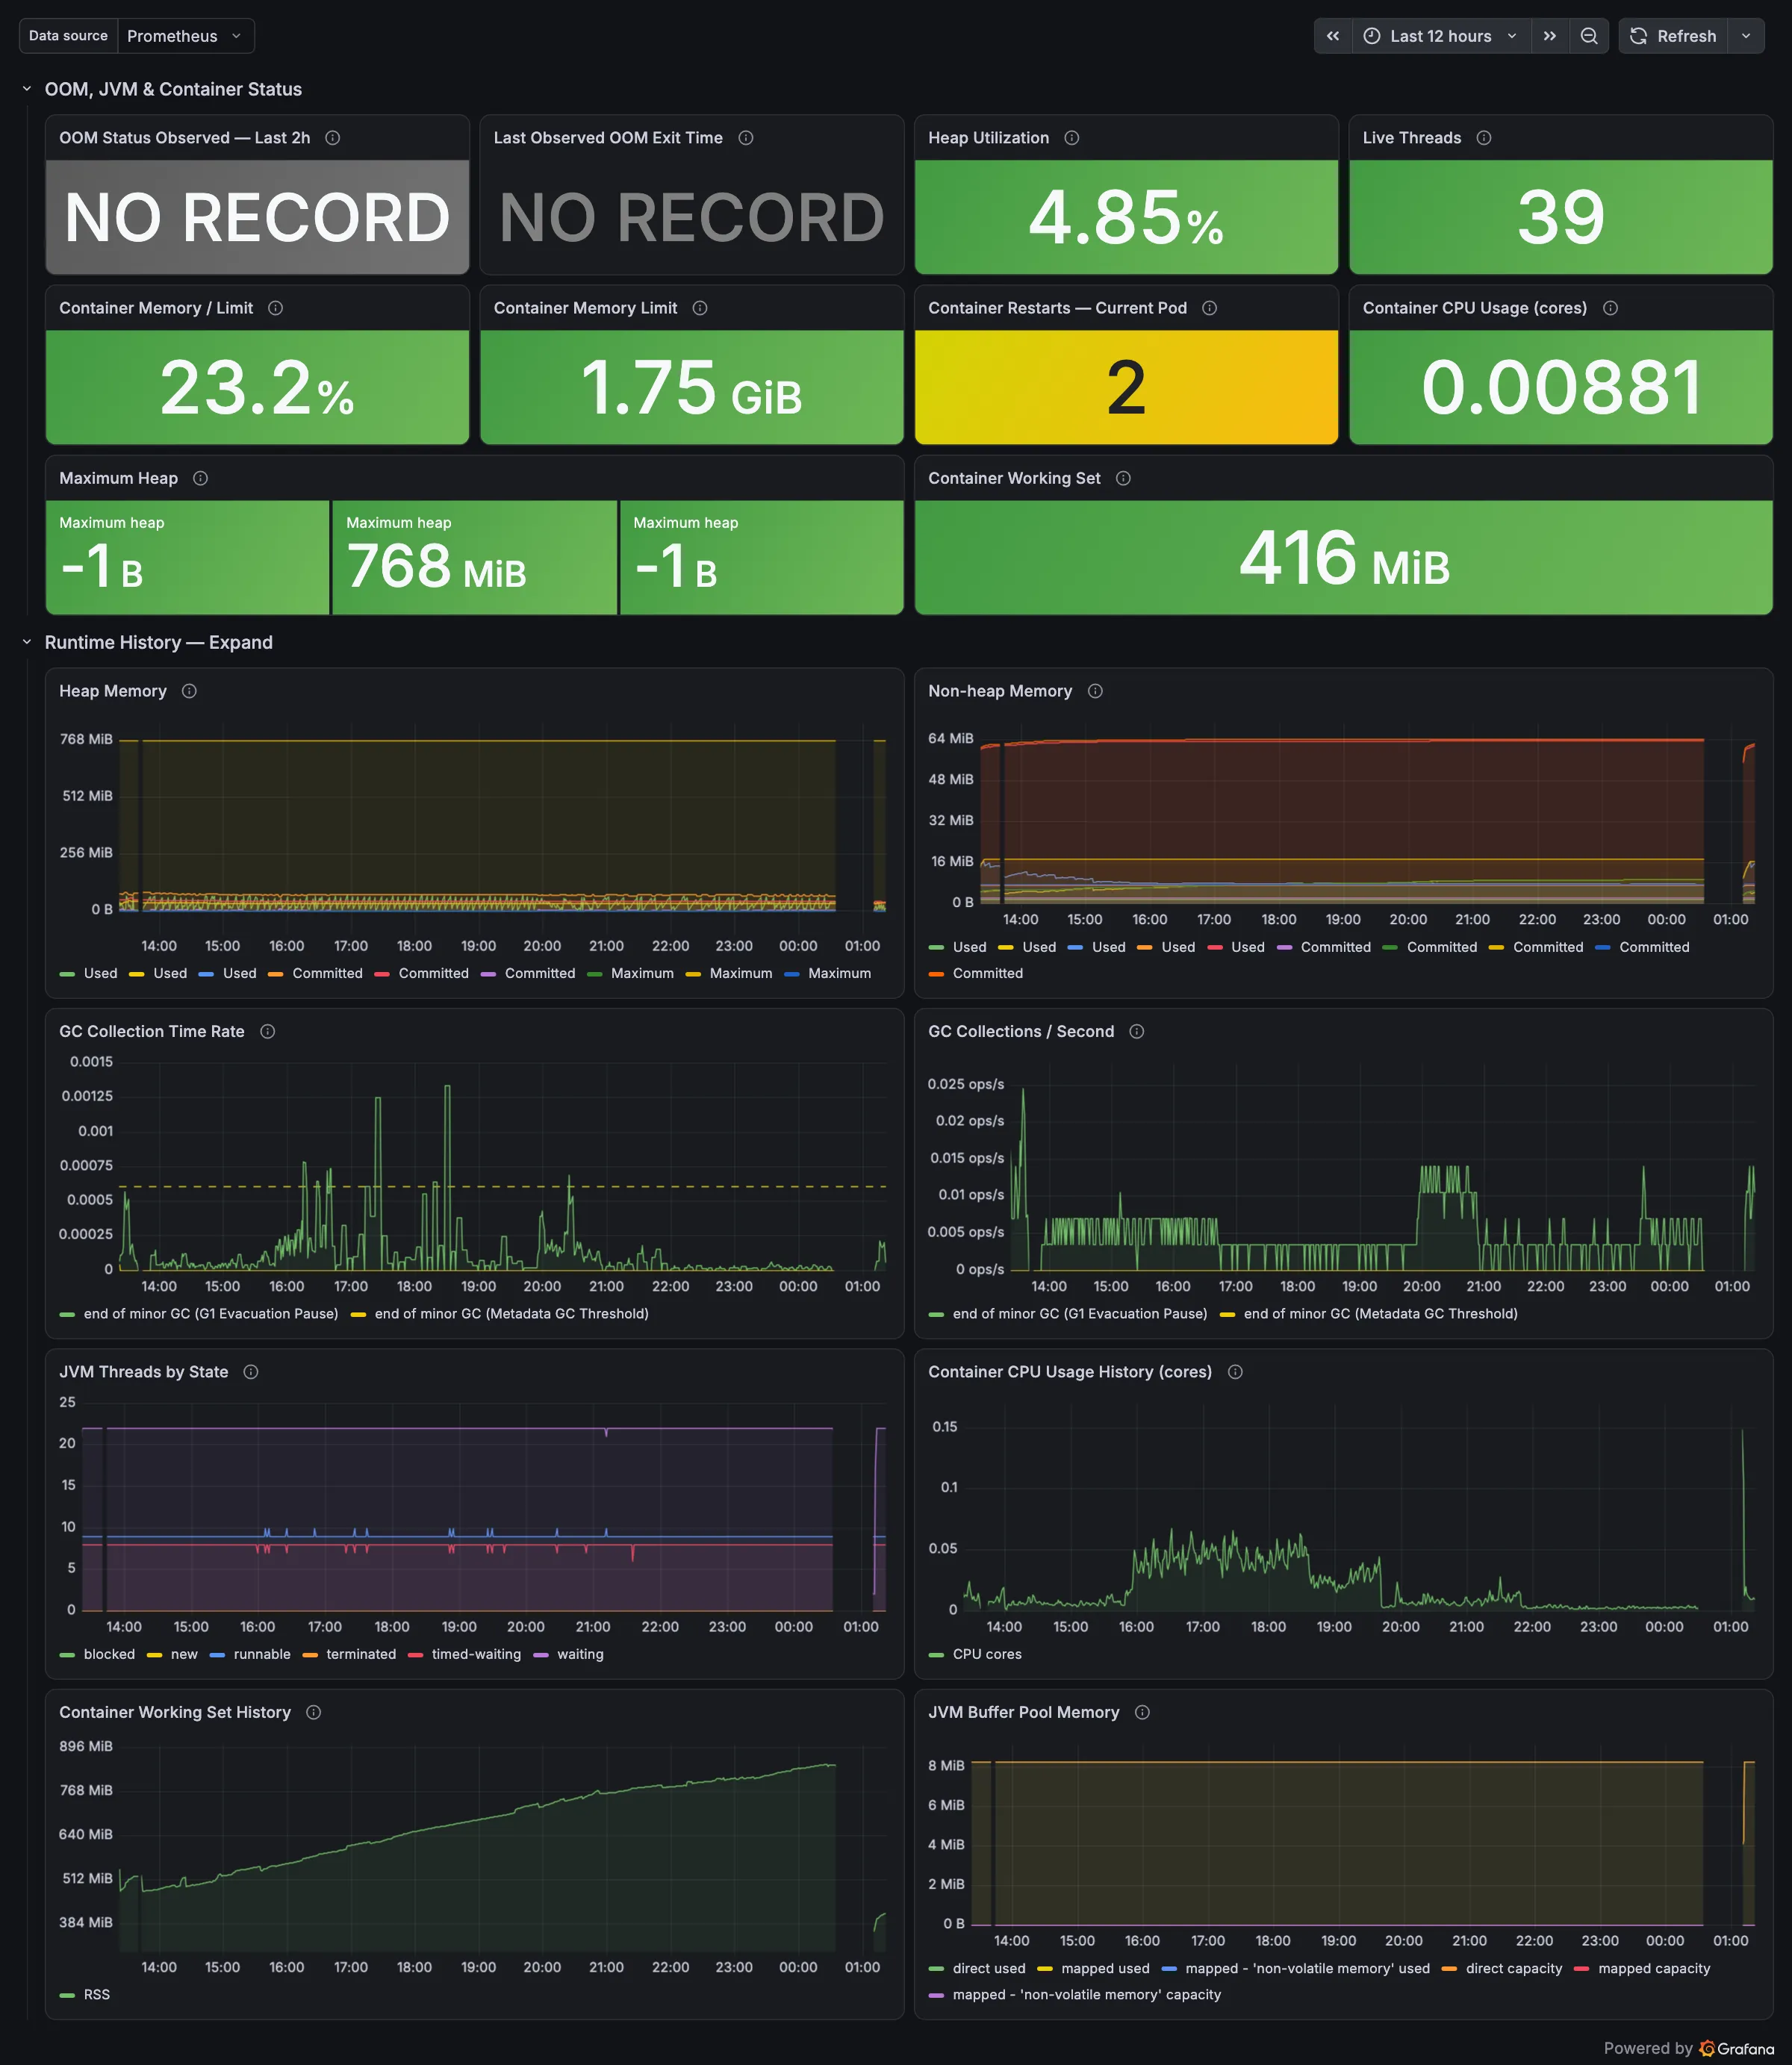
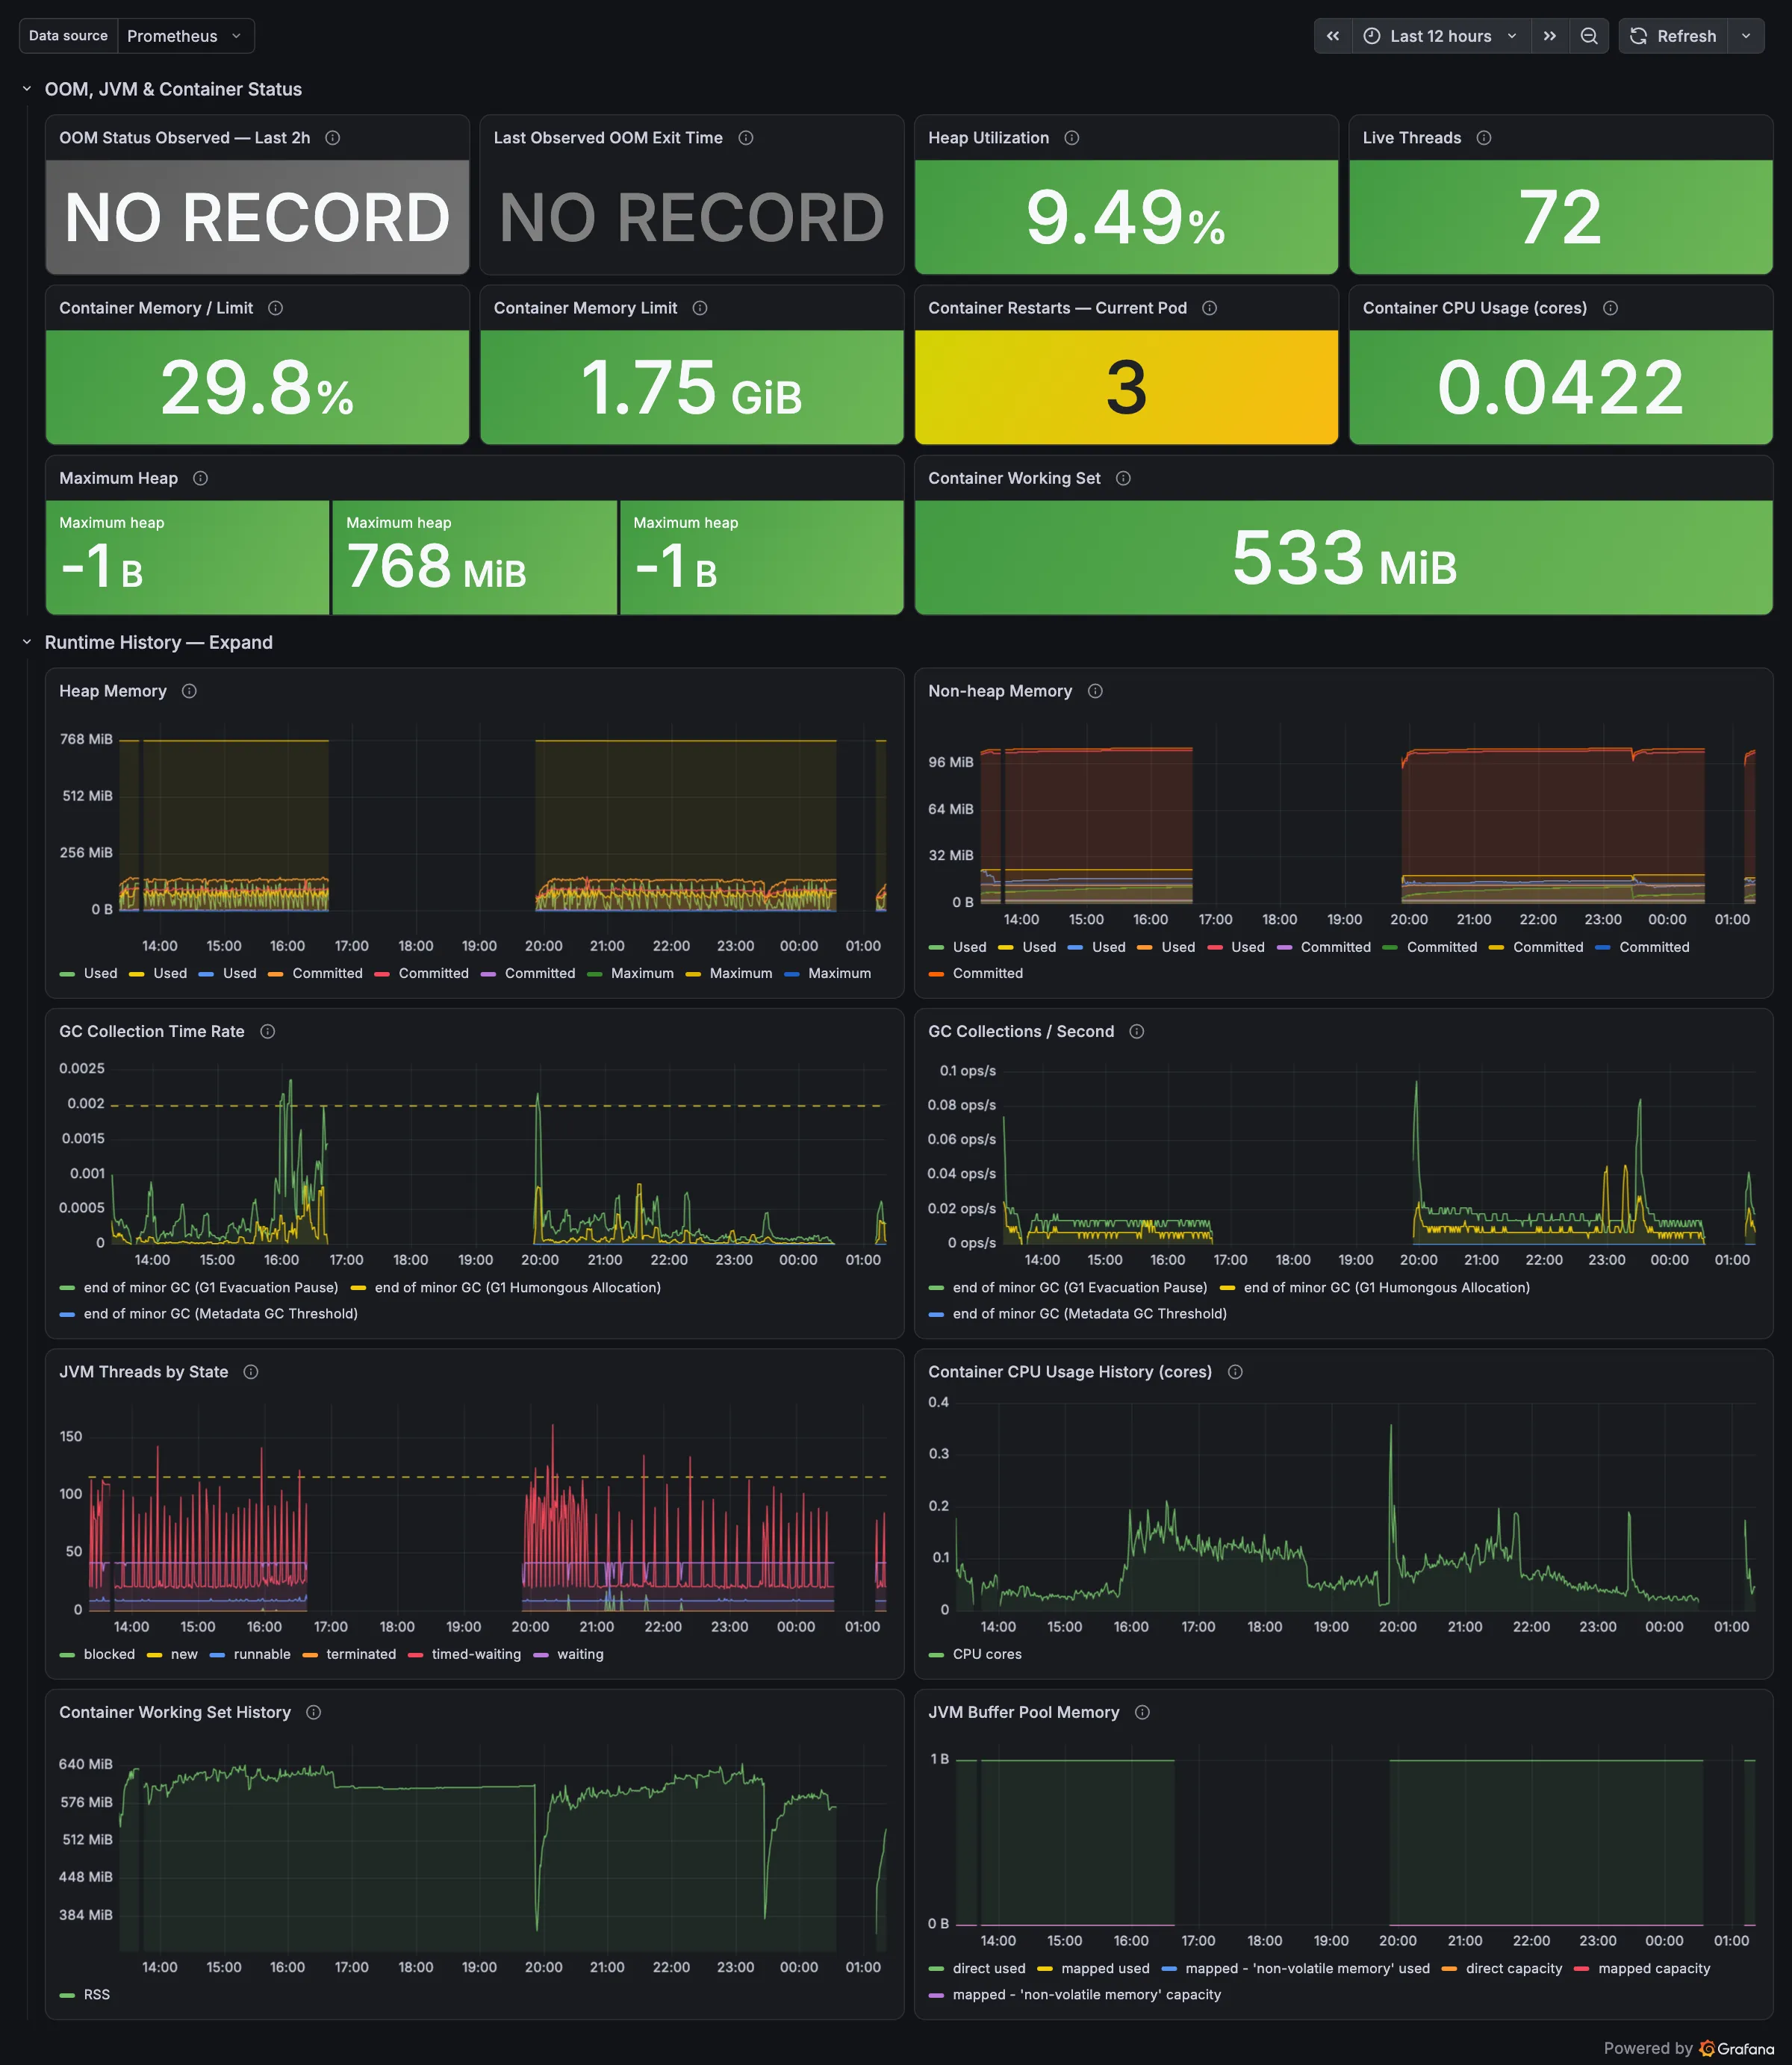
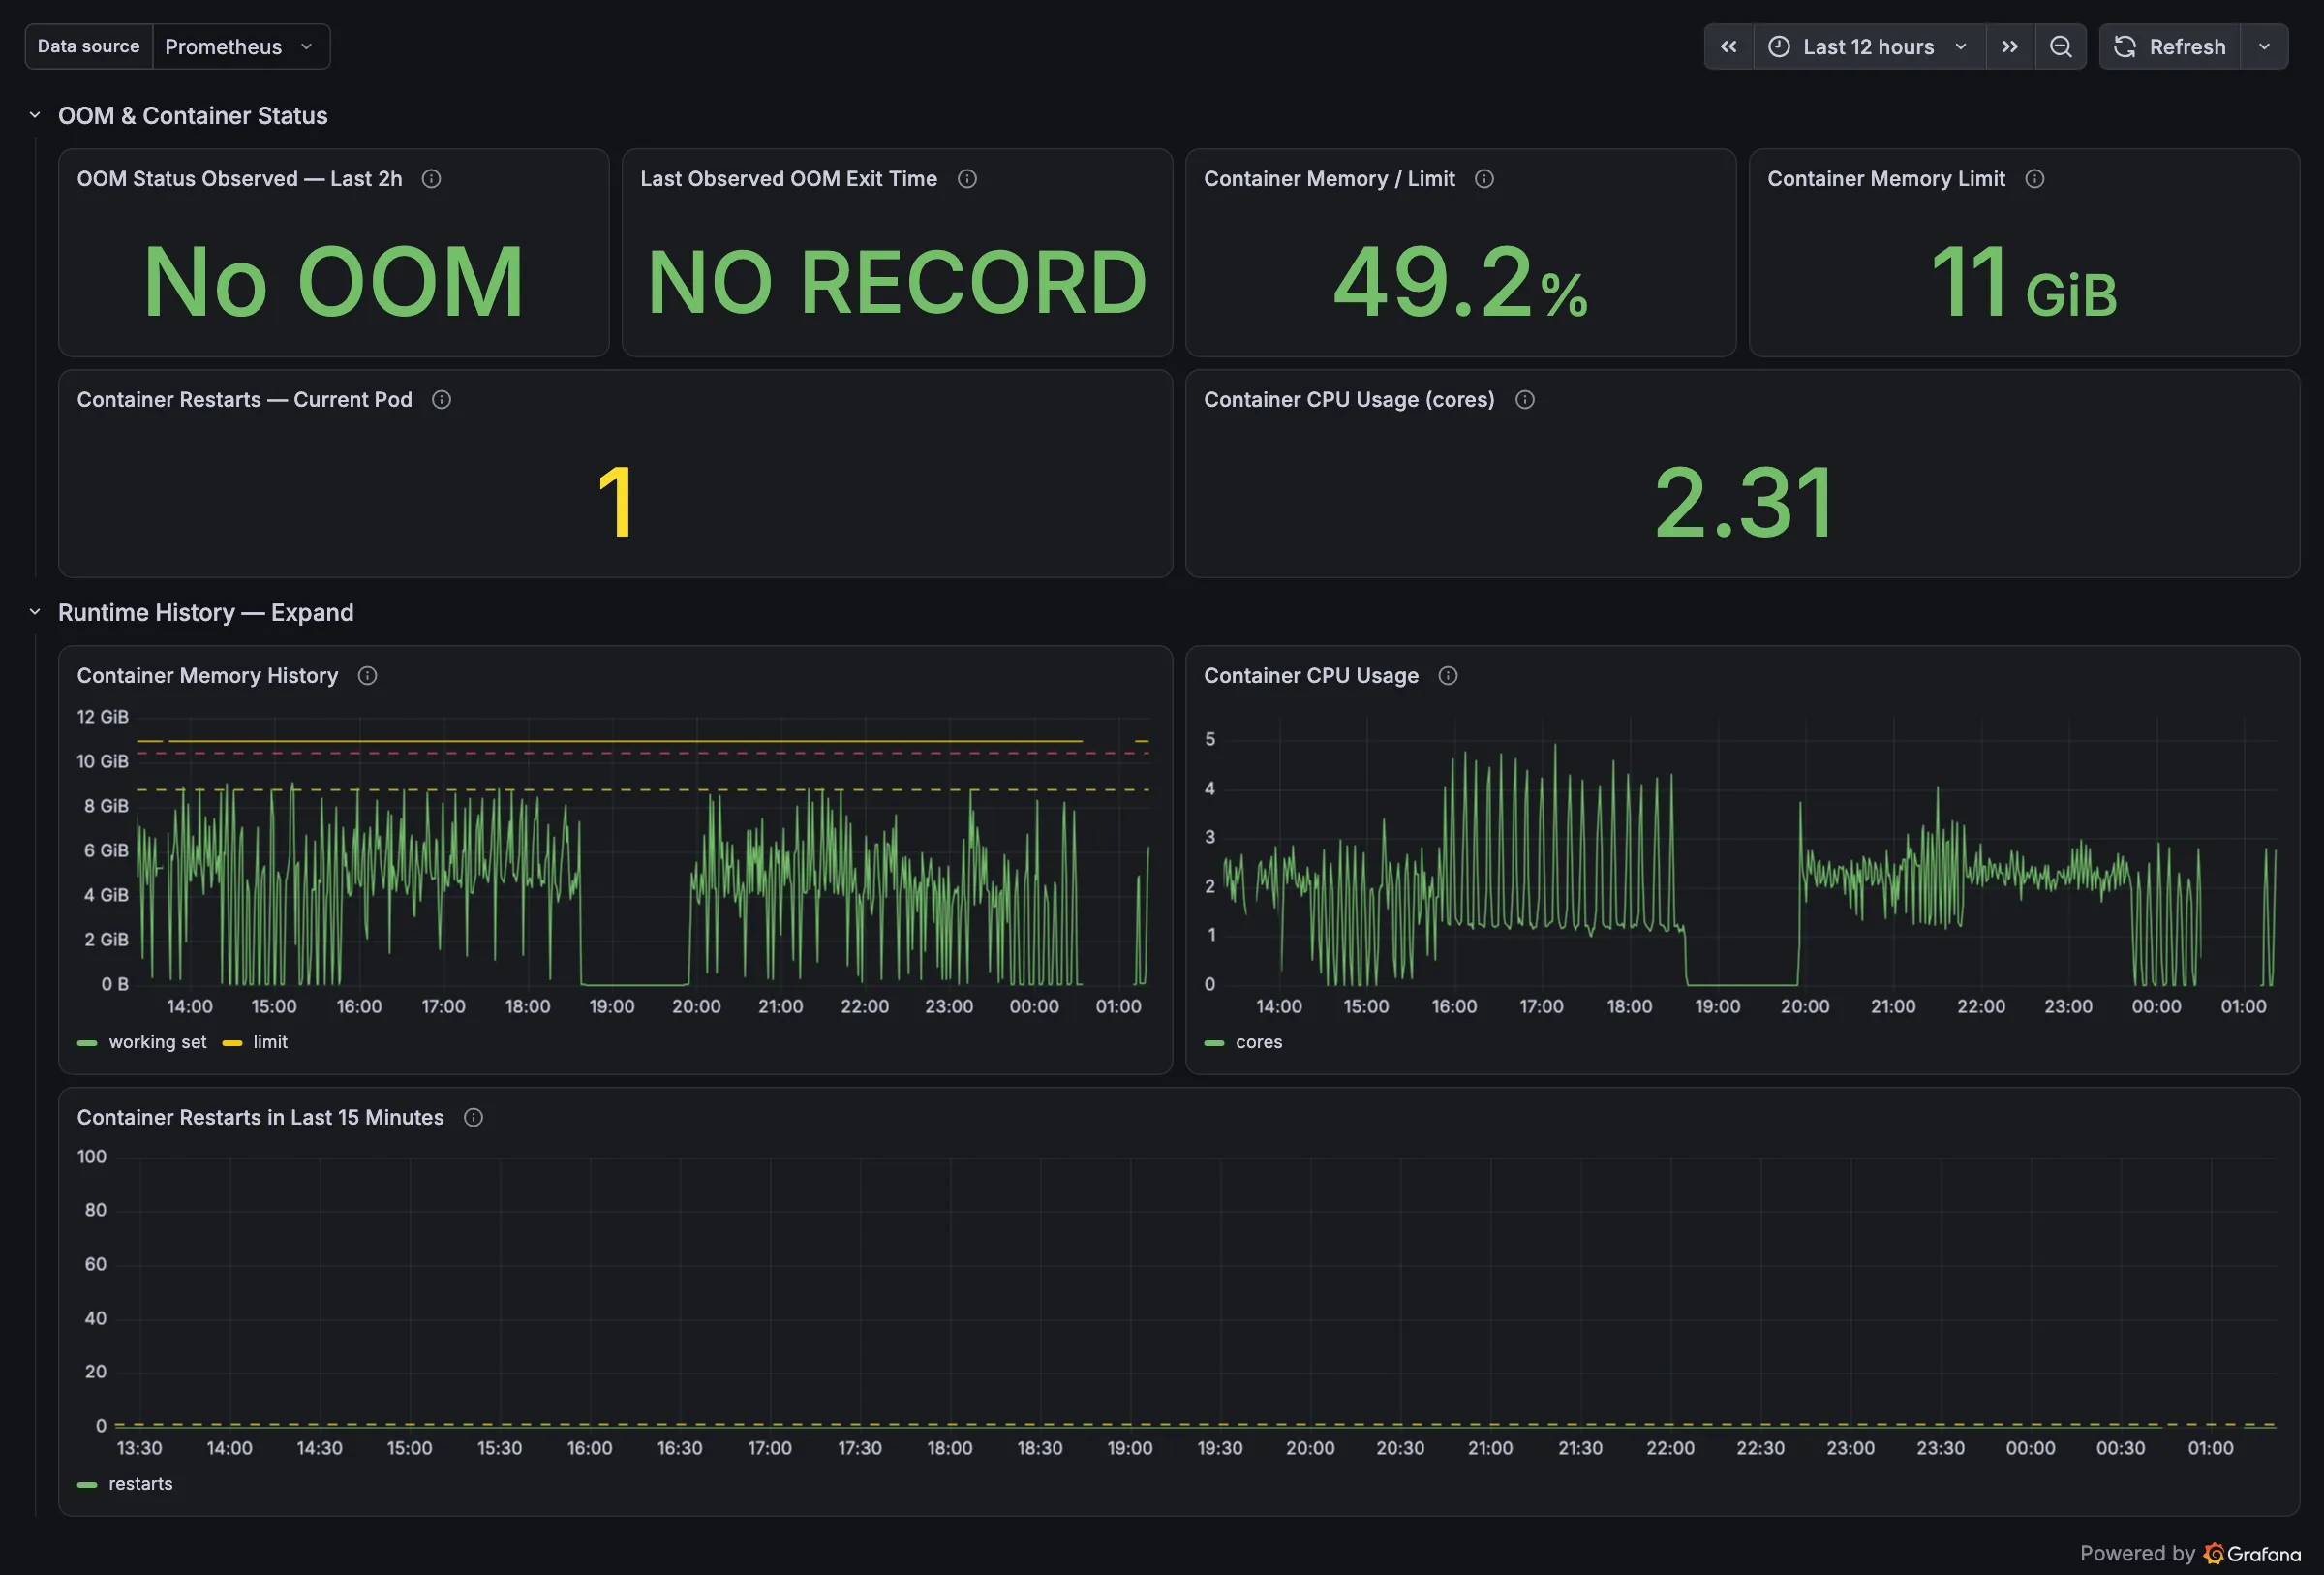
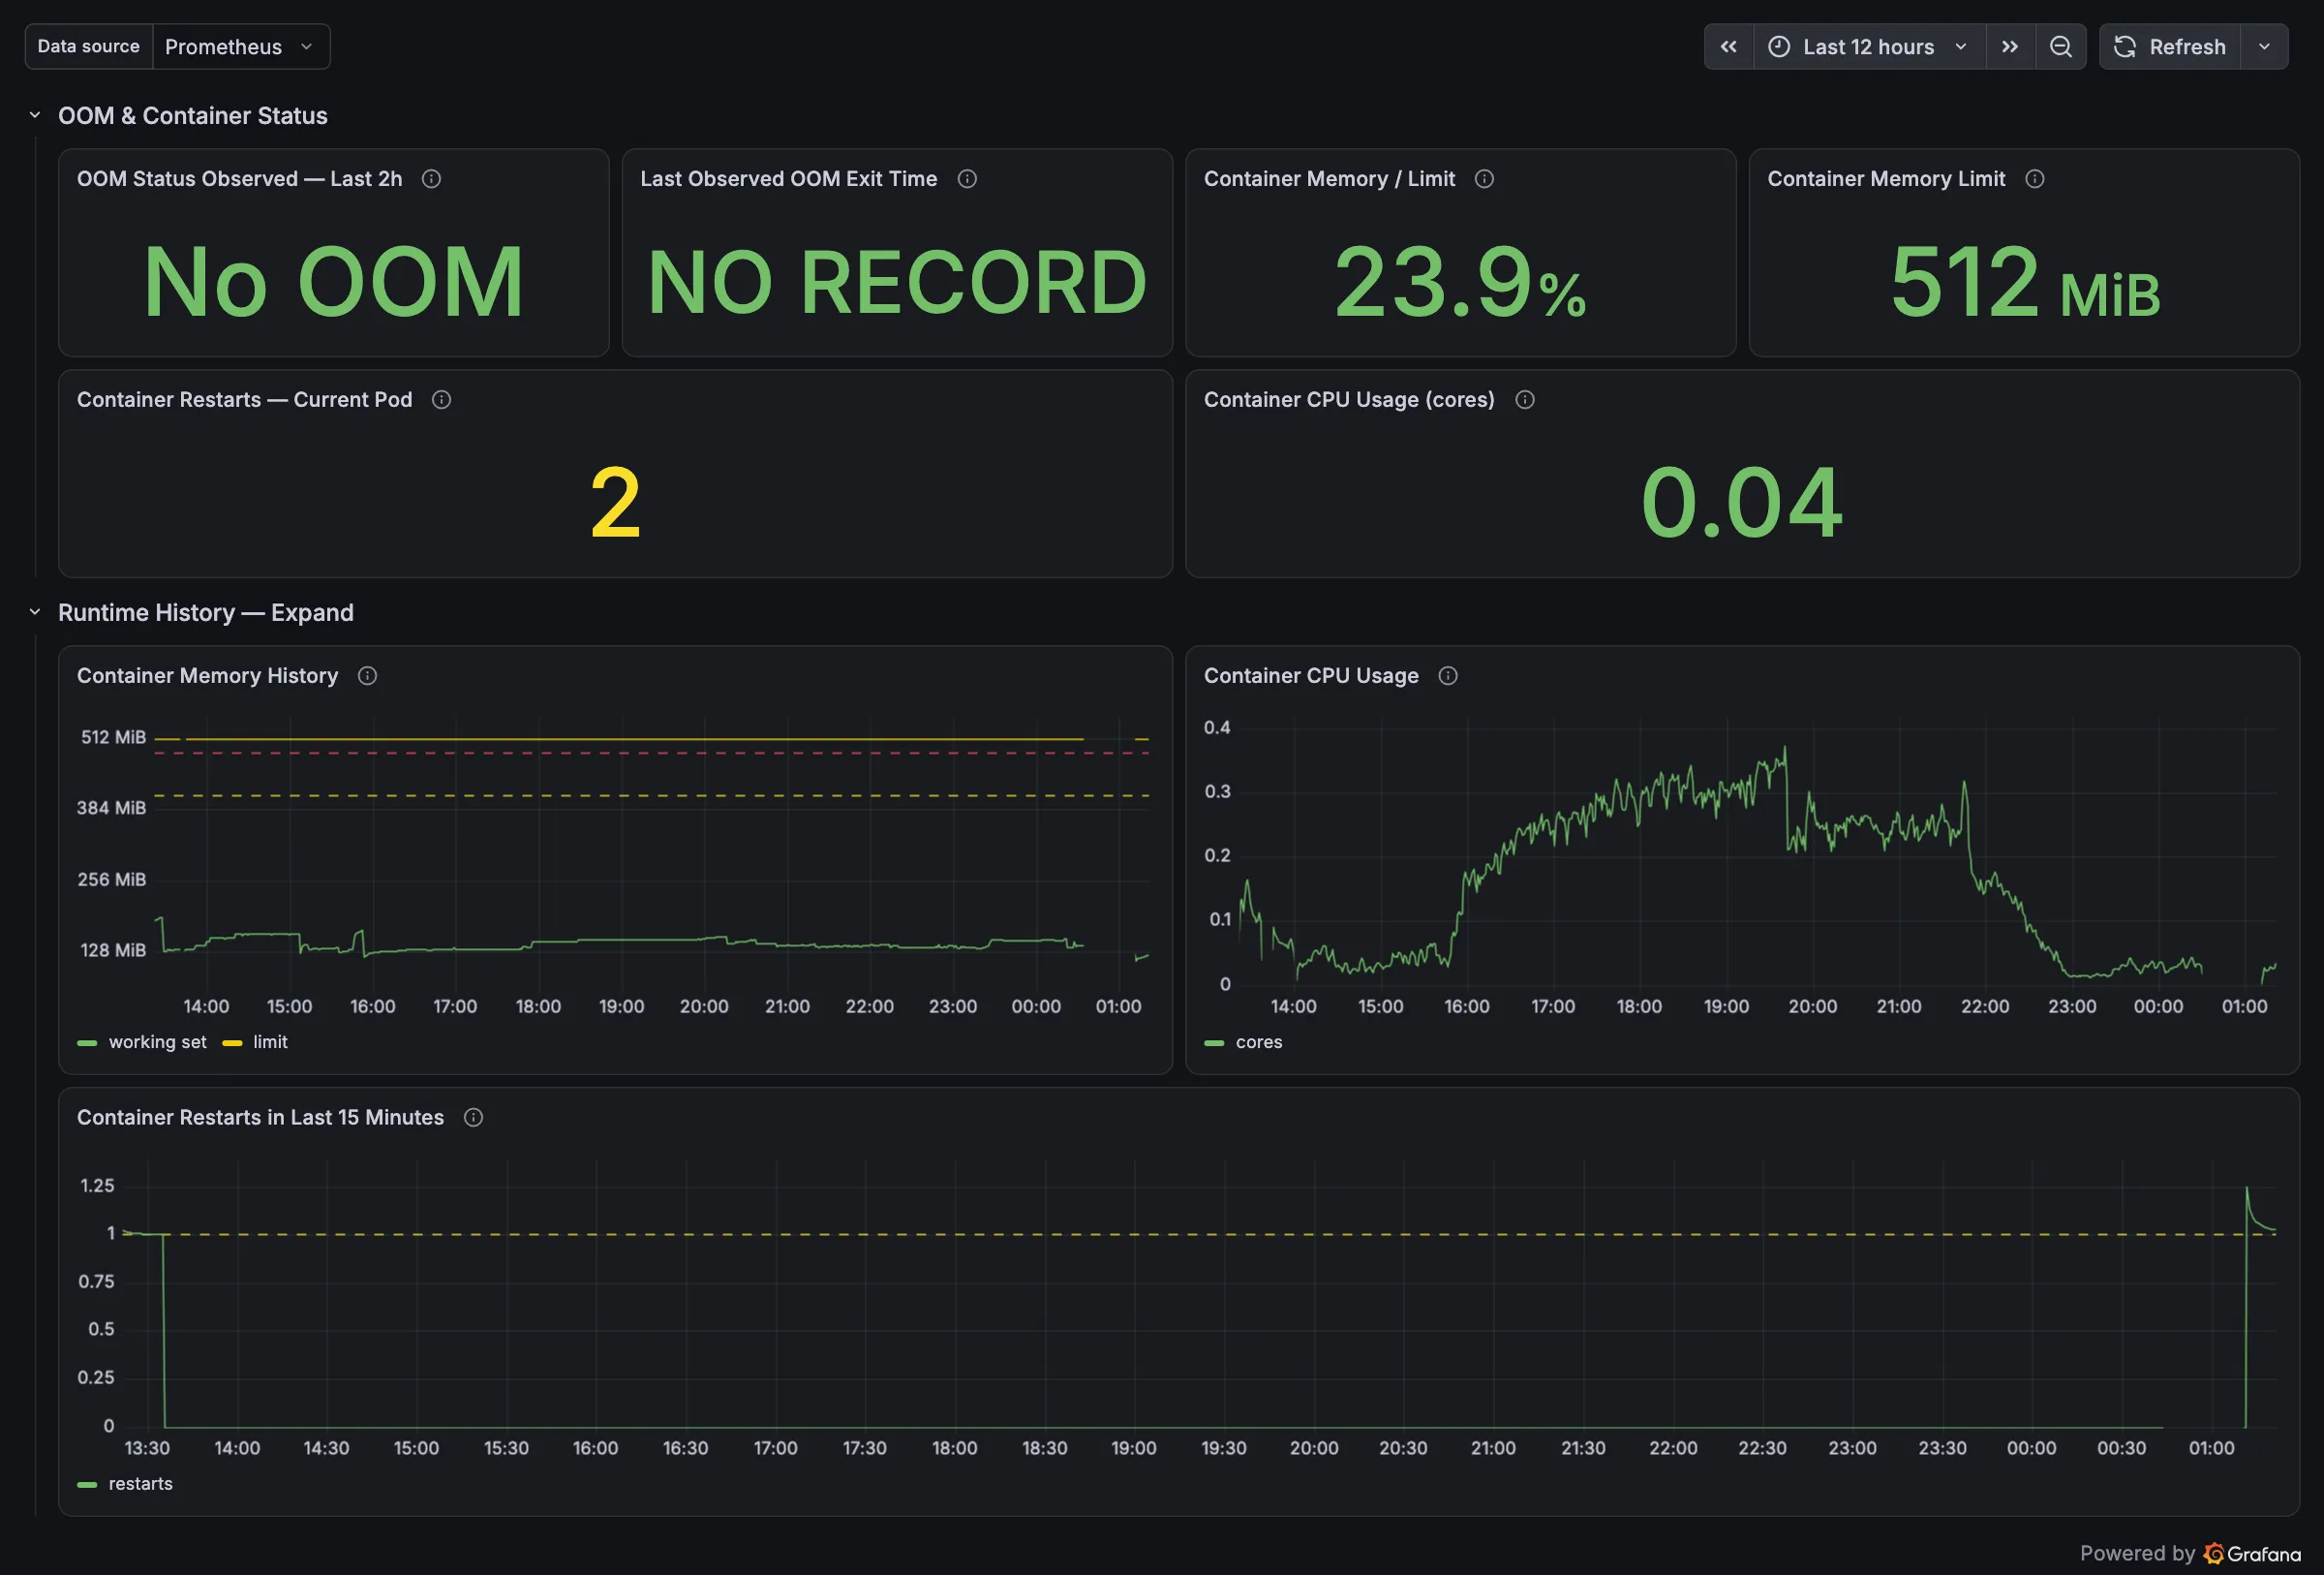
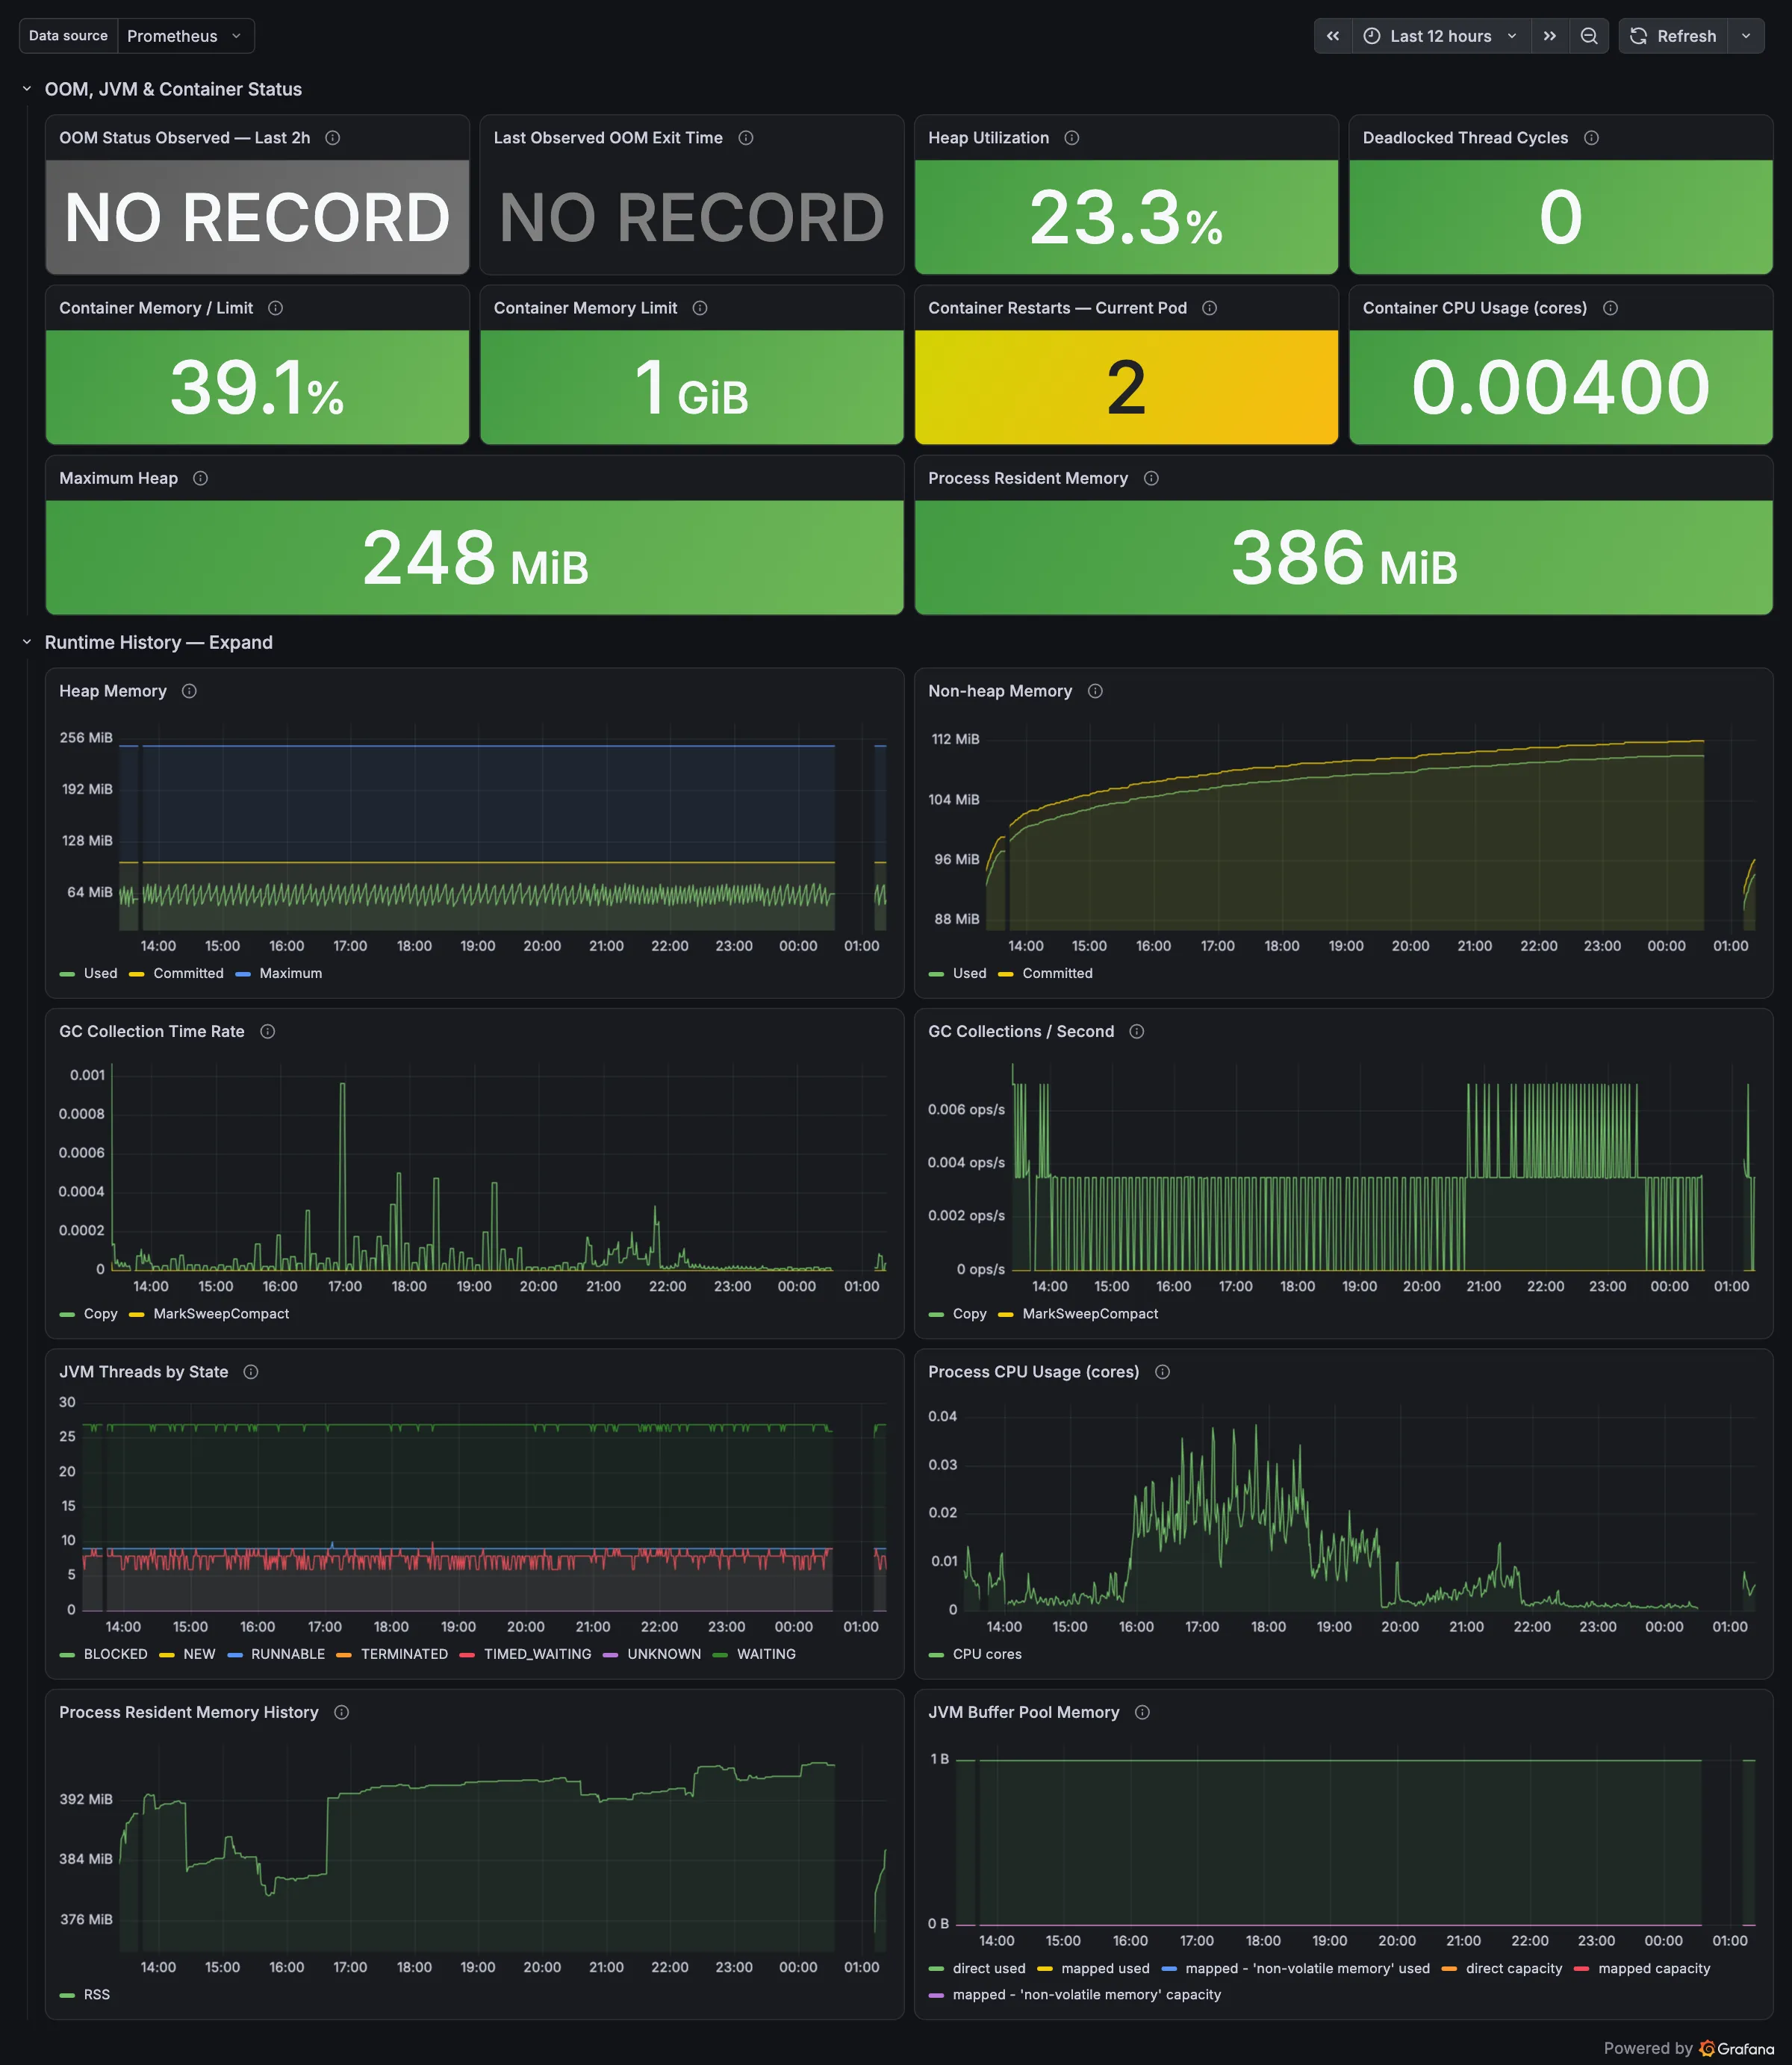
One per component, same layout for all: scrape and OOM status, JVM heap and GC (for the Java components), container memory against its limit, CPU, restarts.
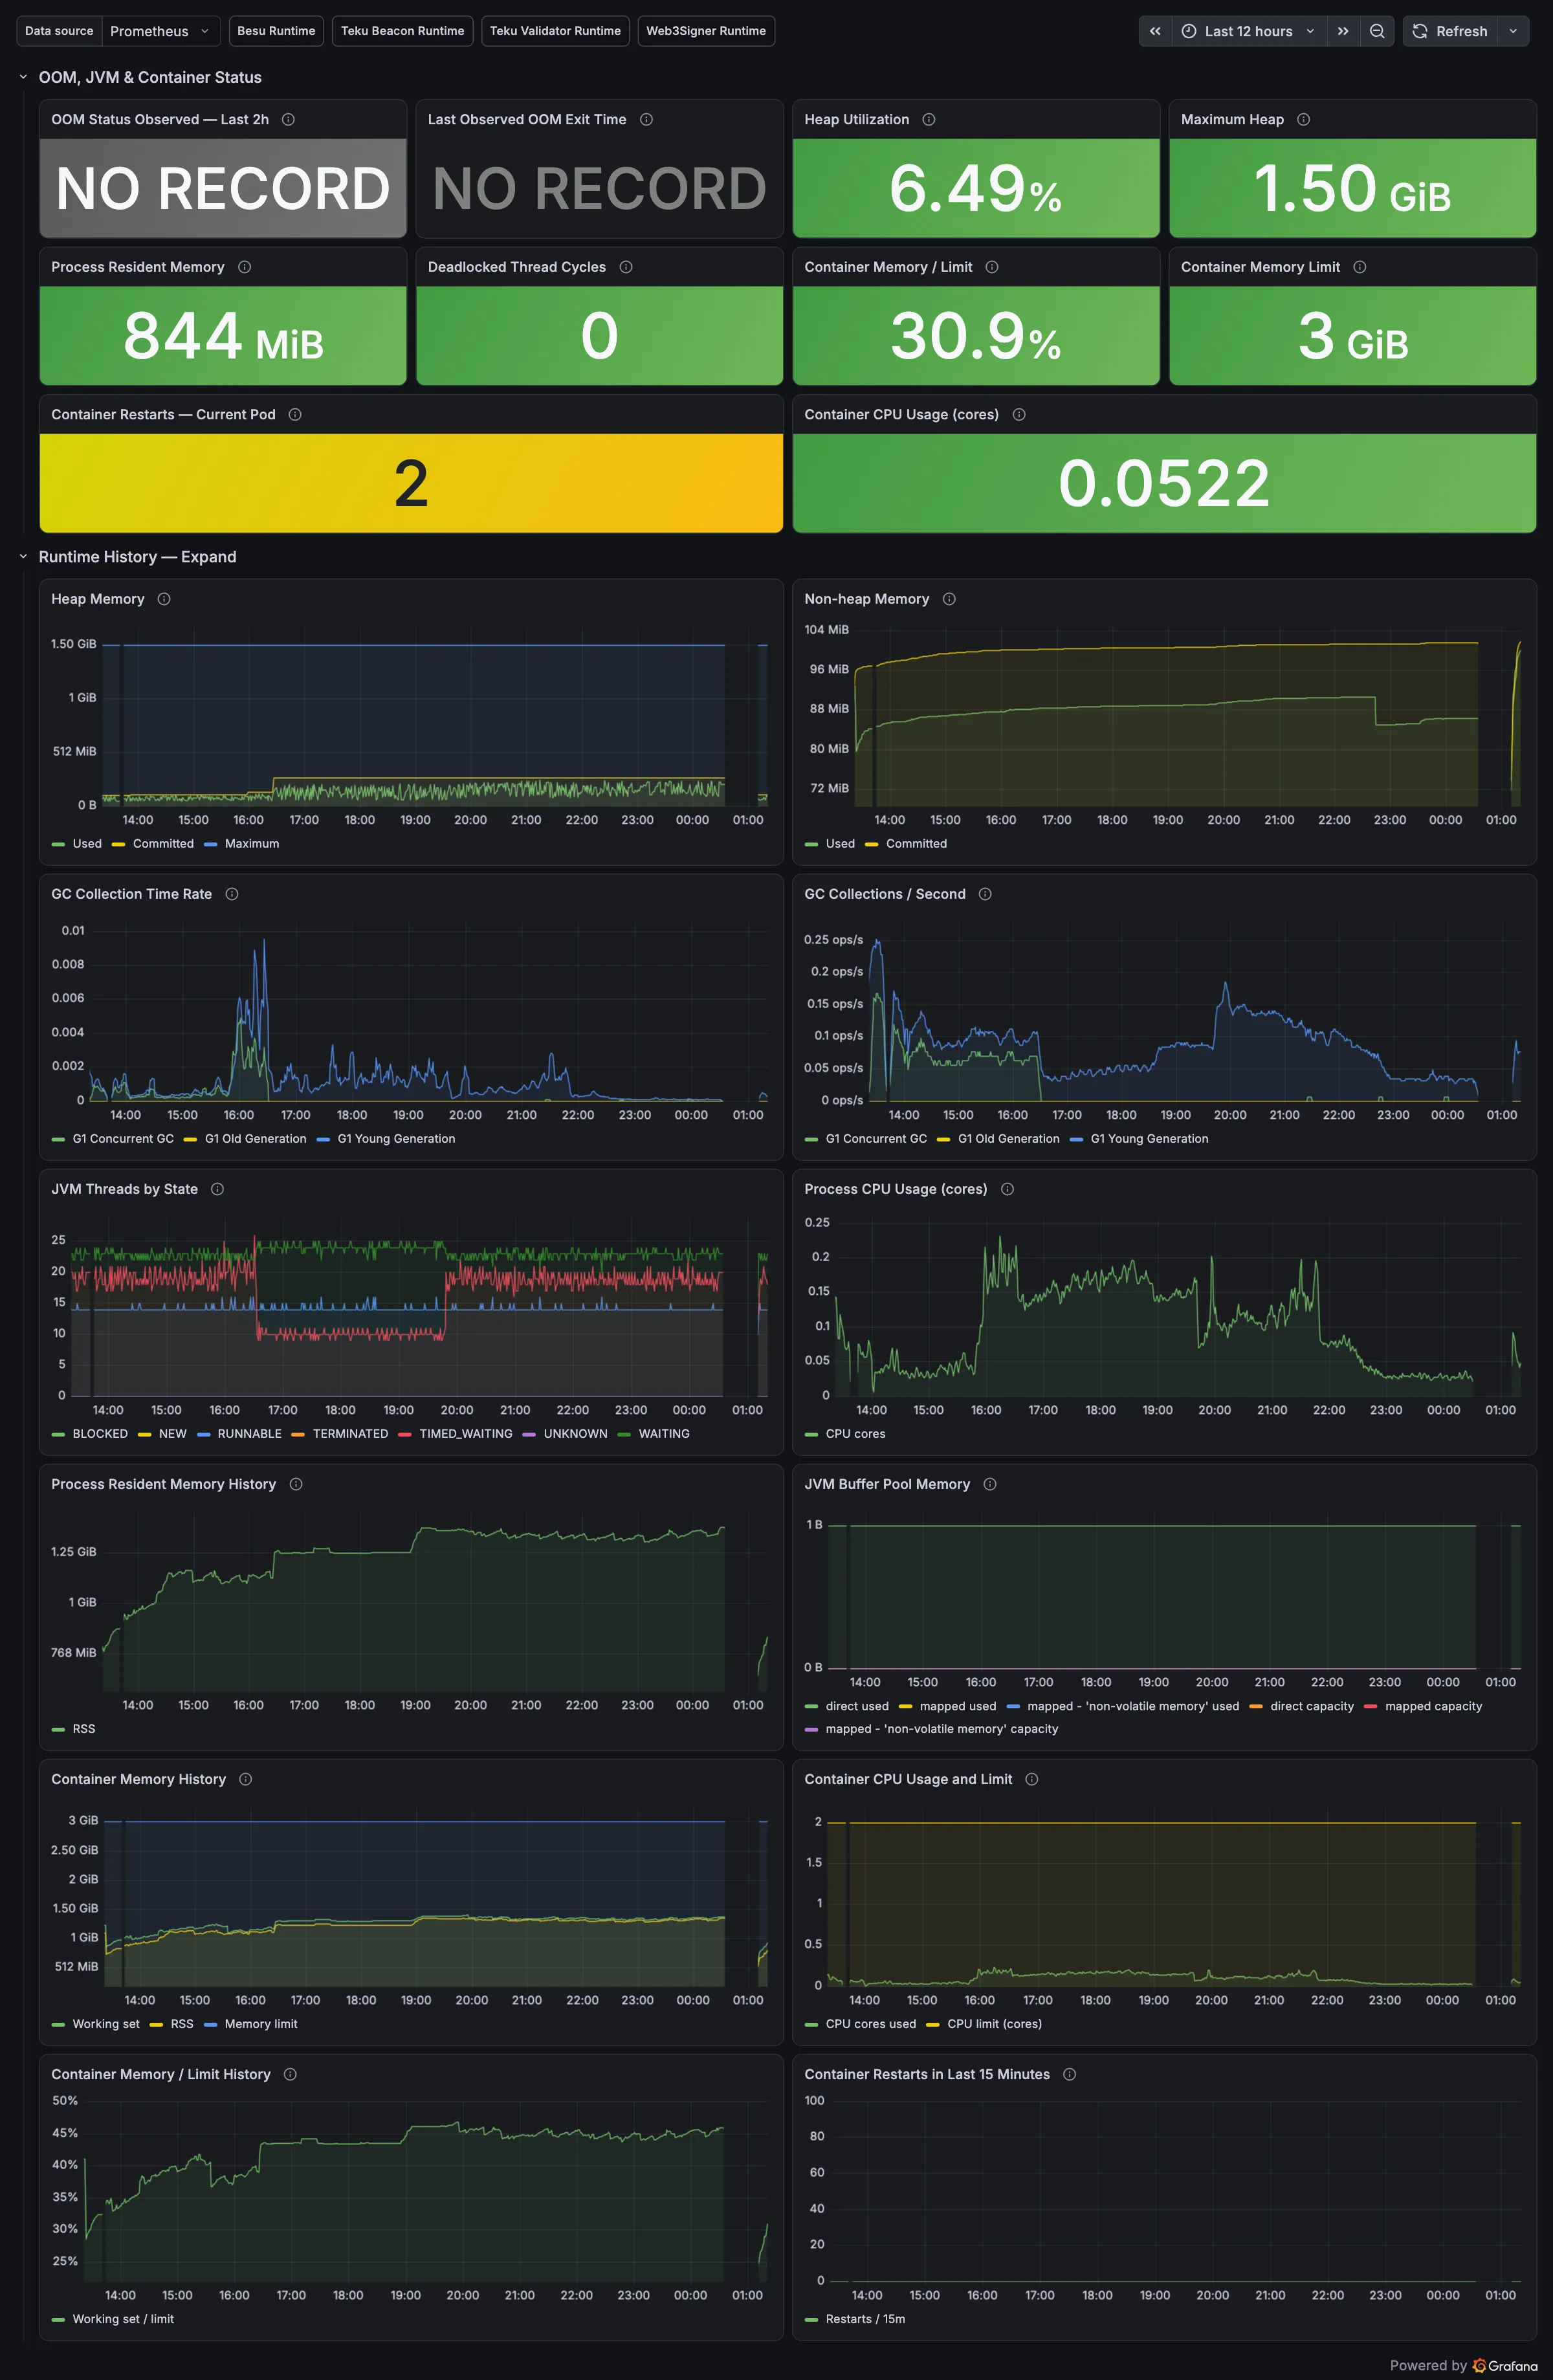
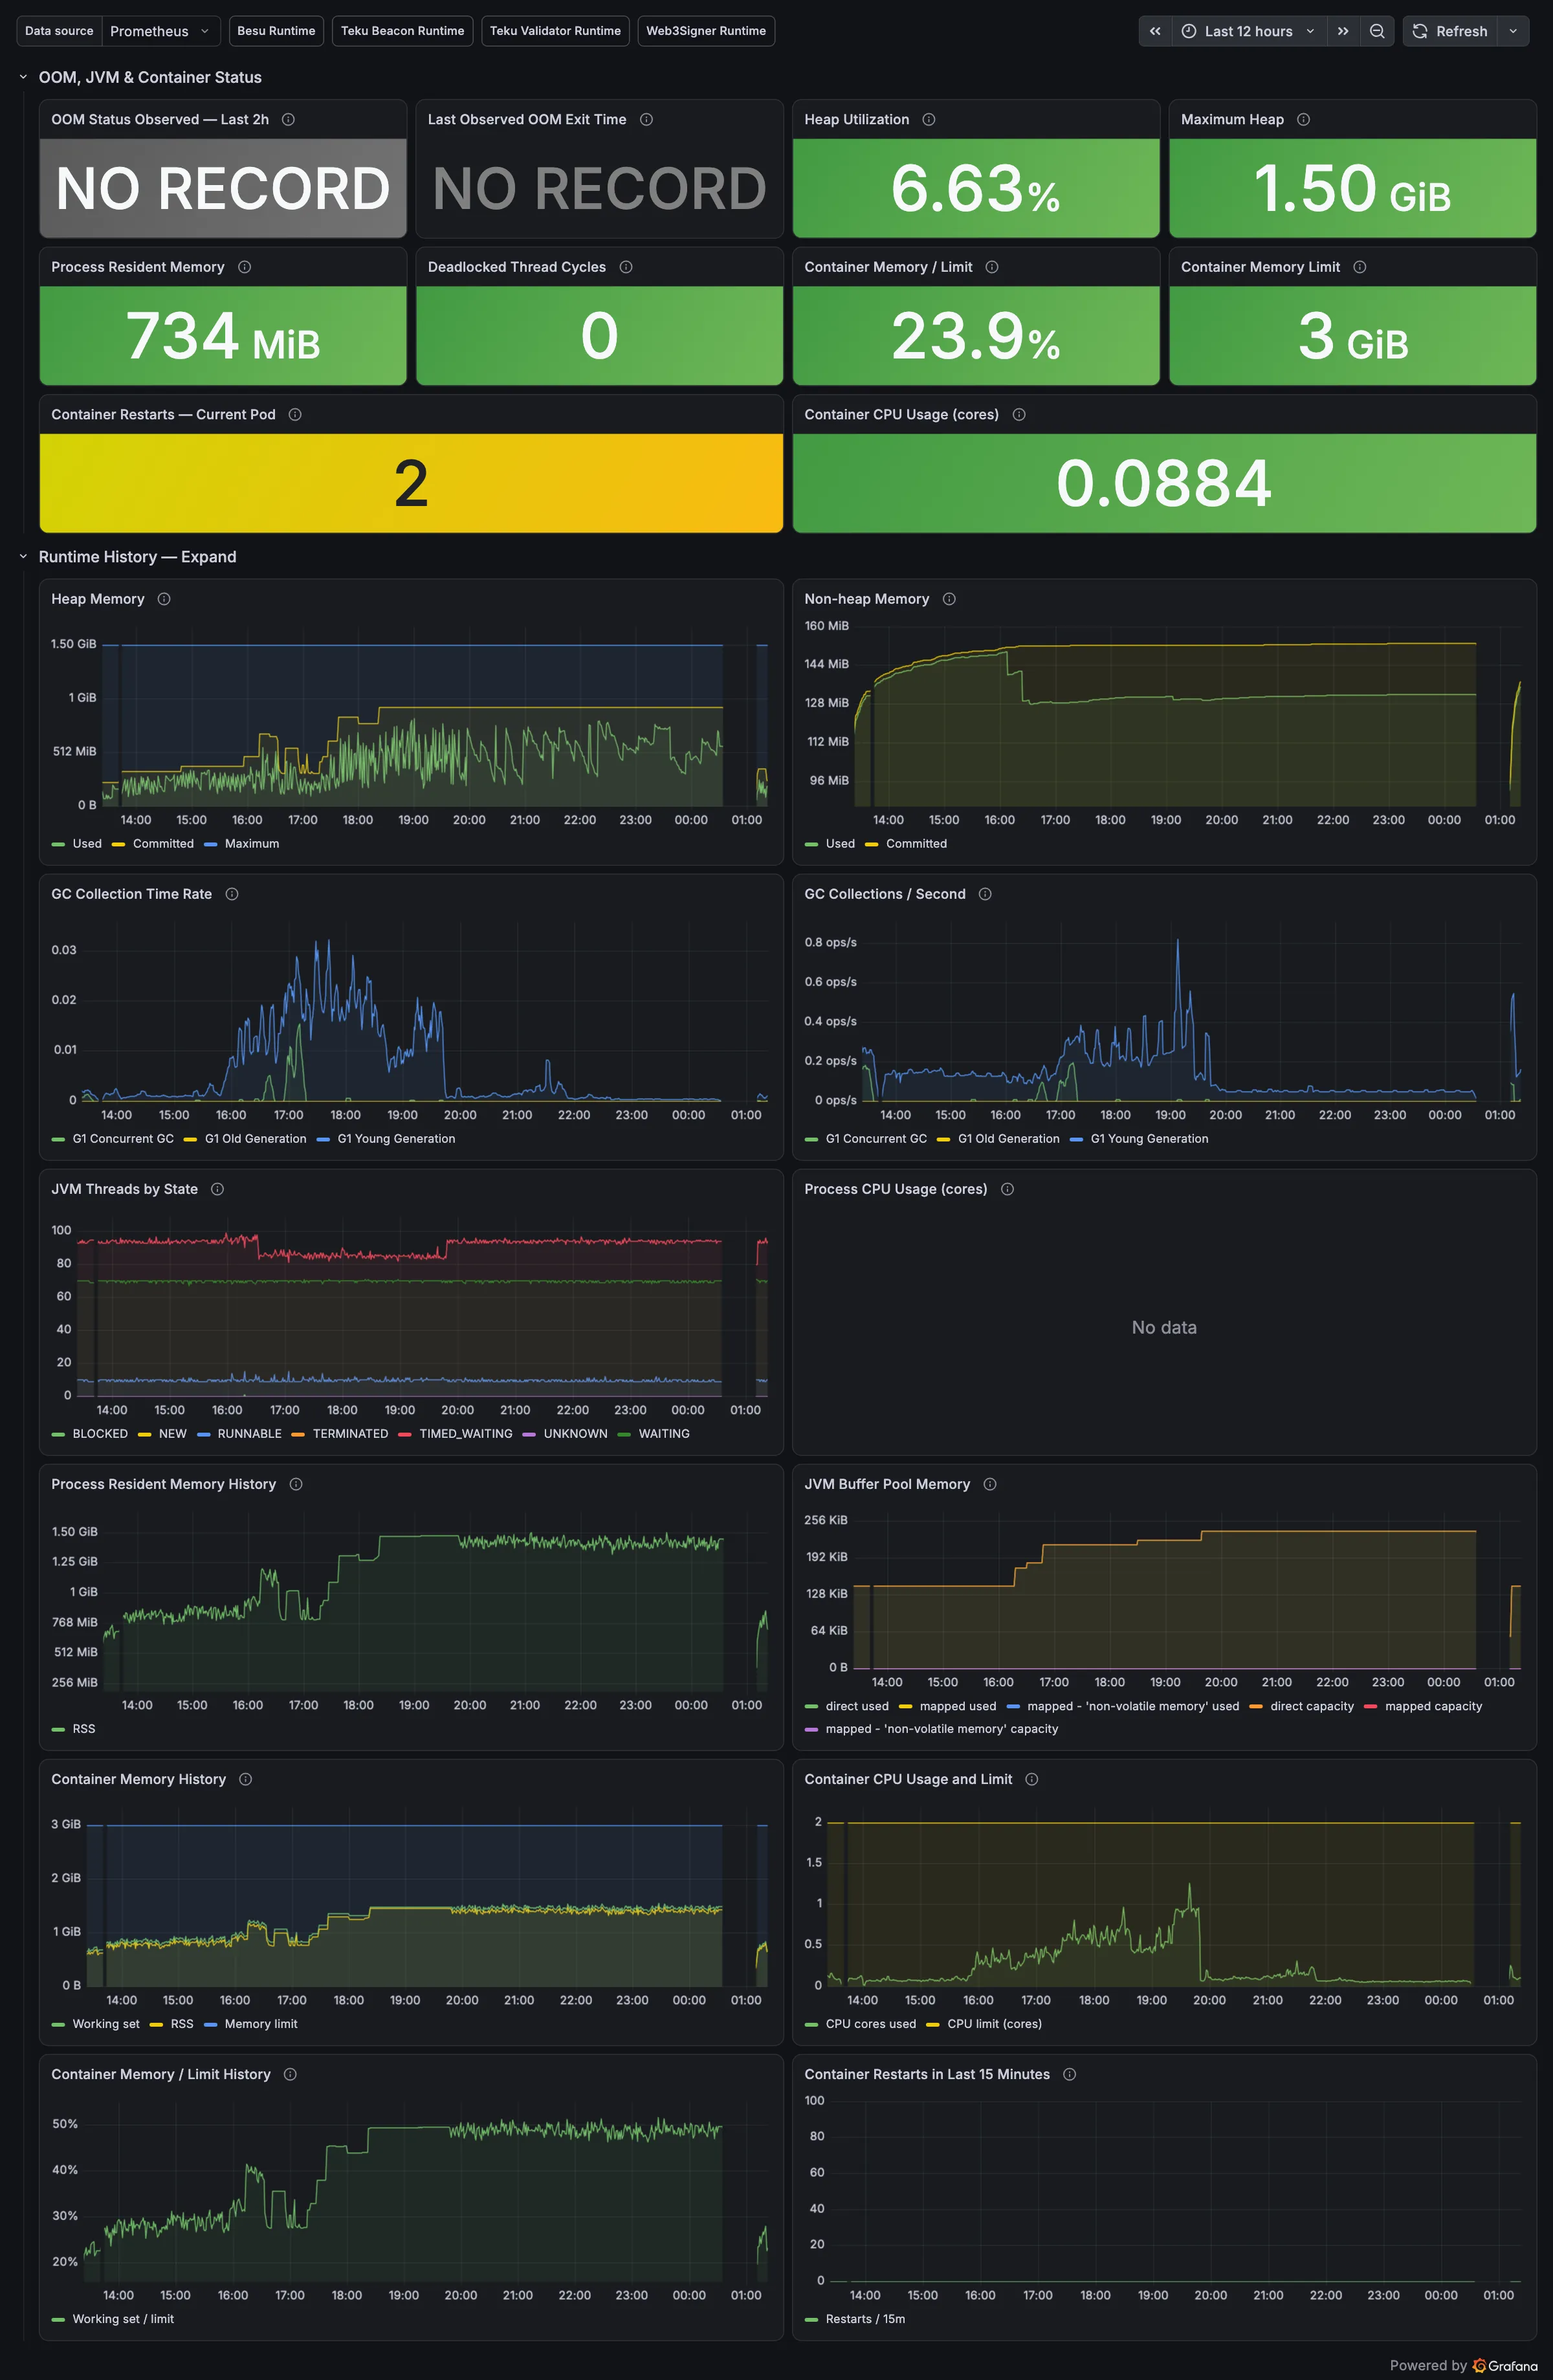
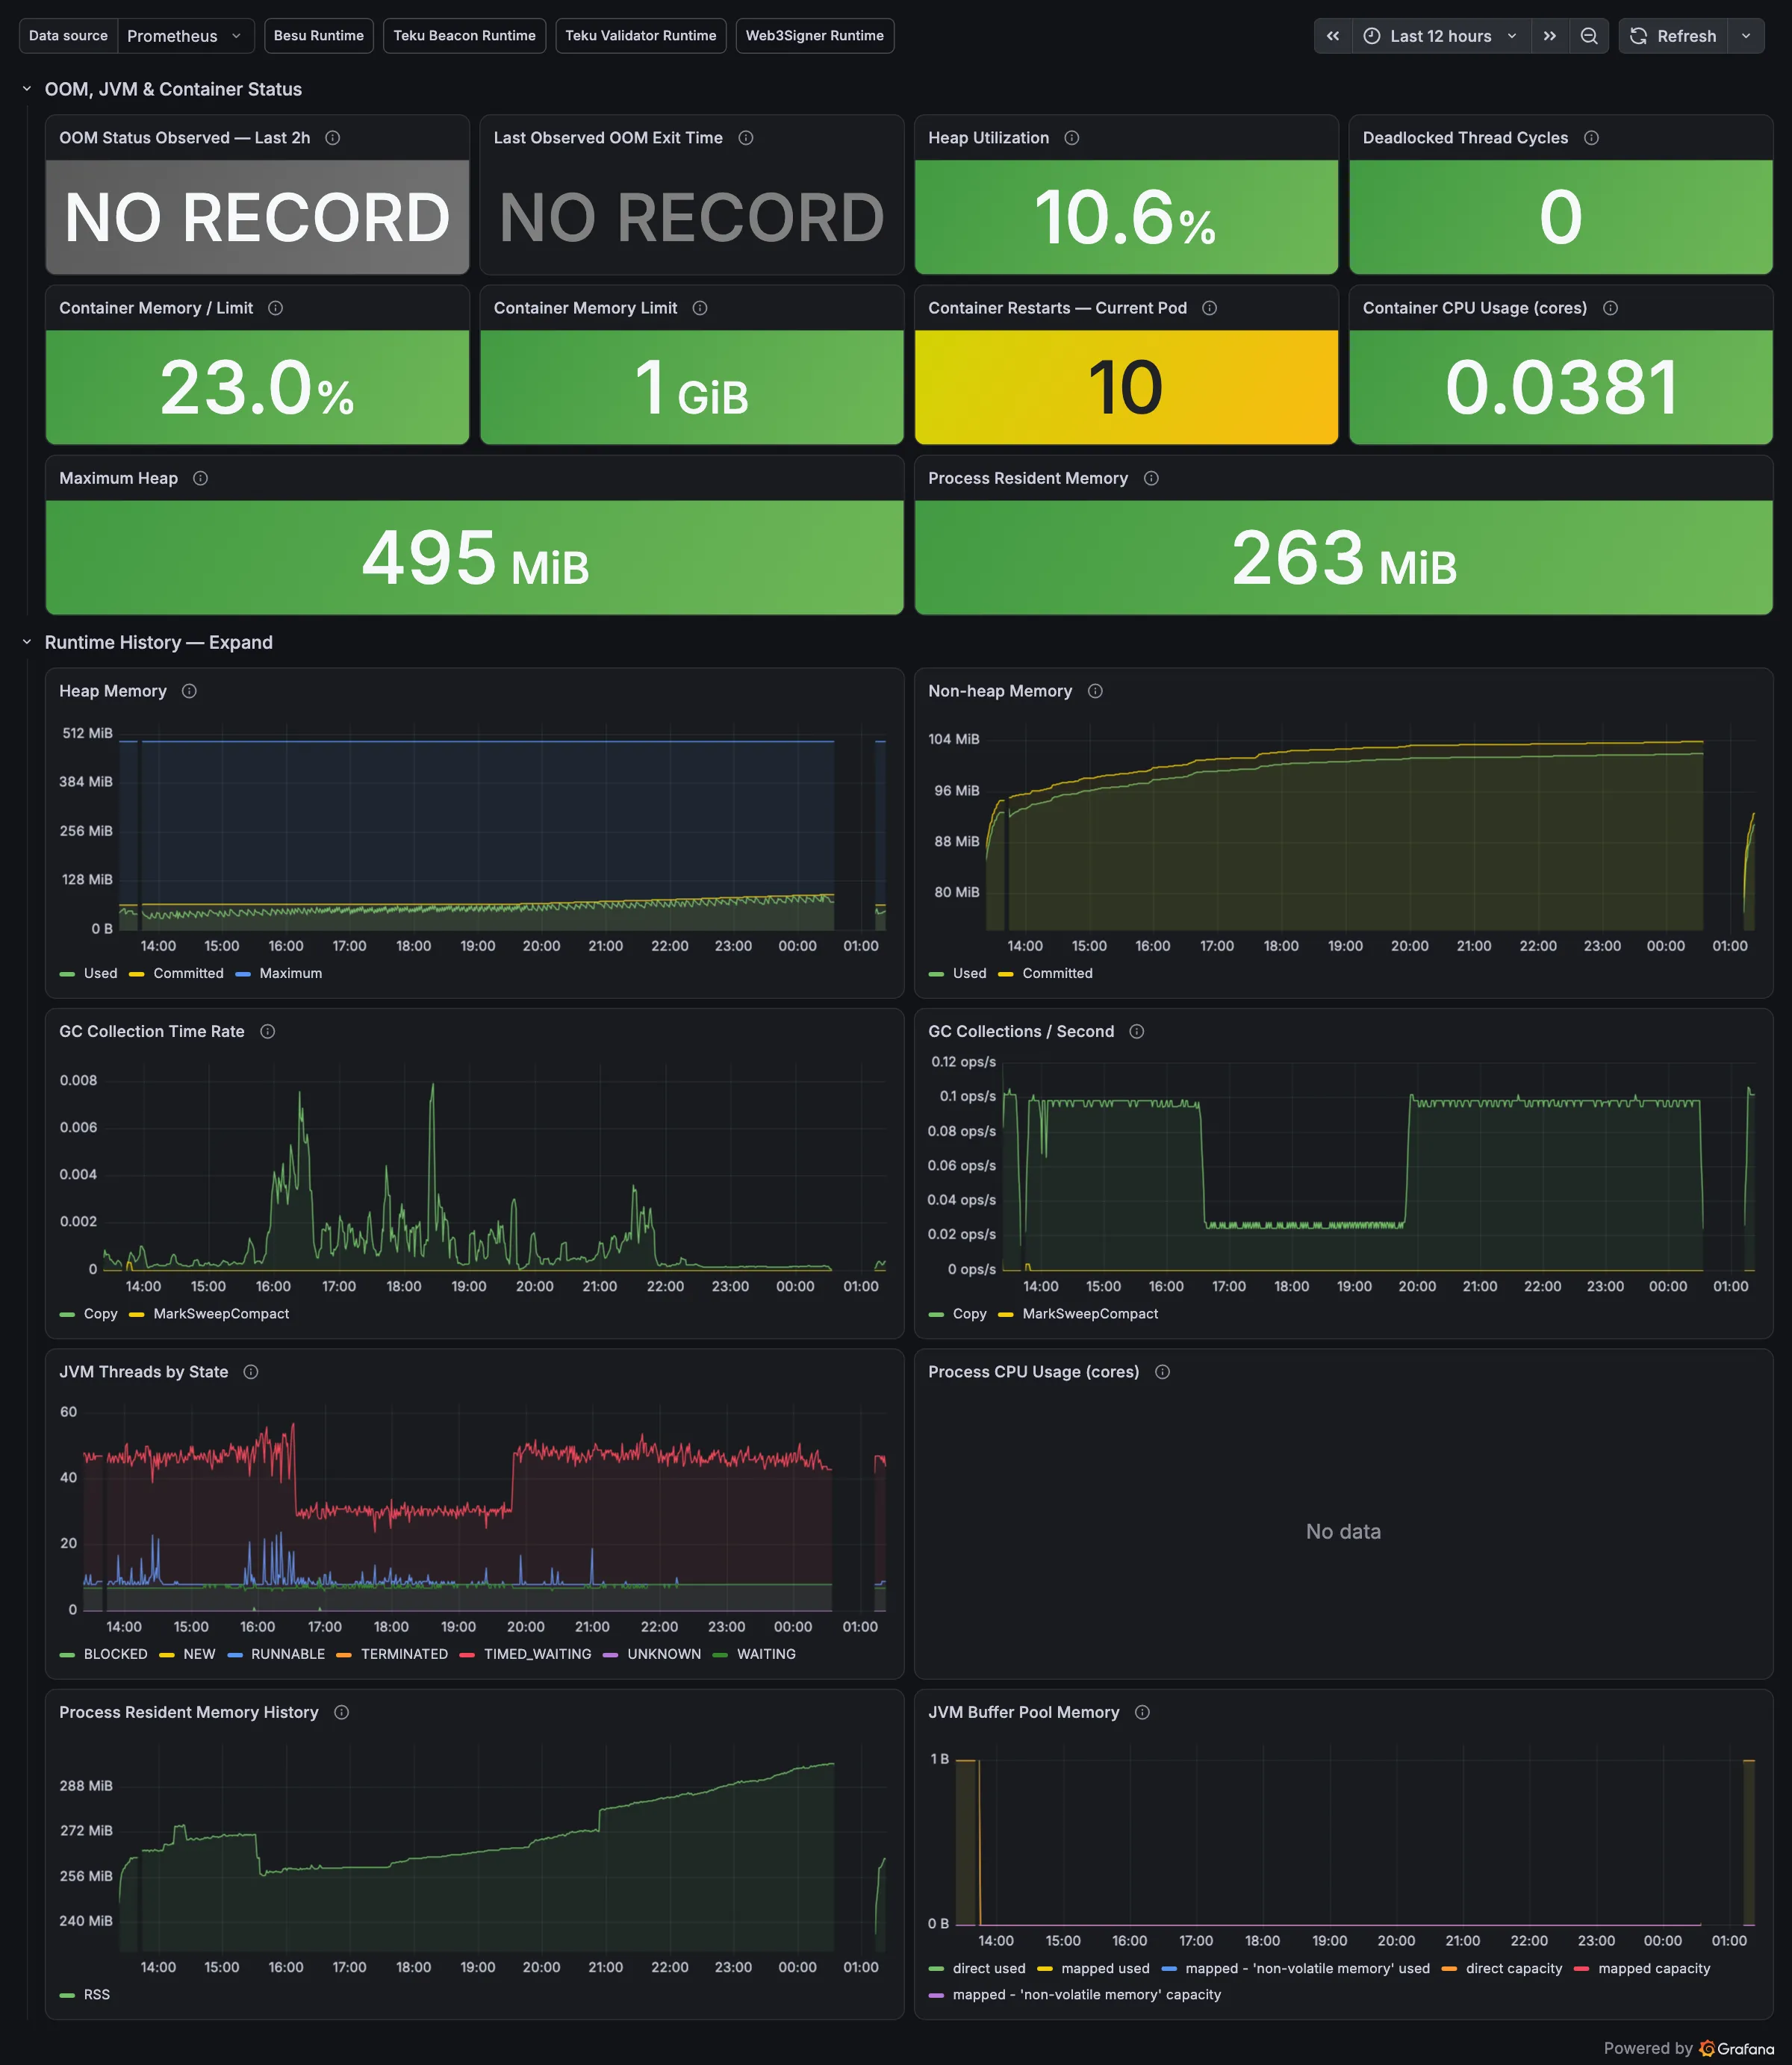
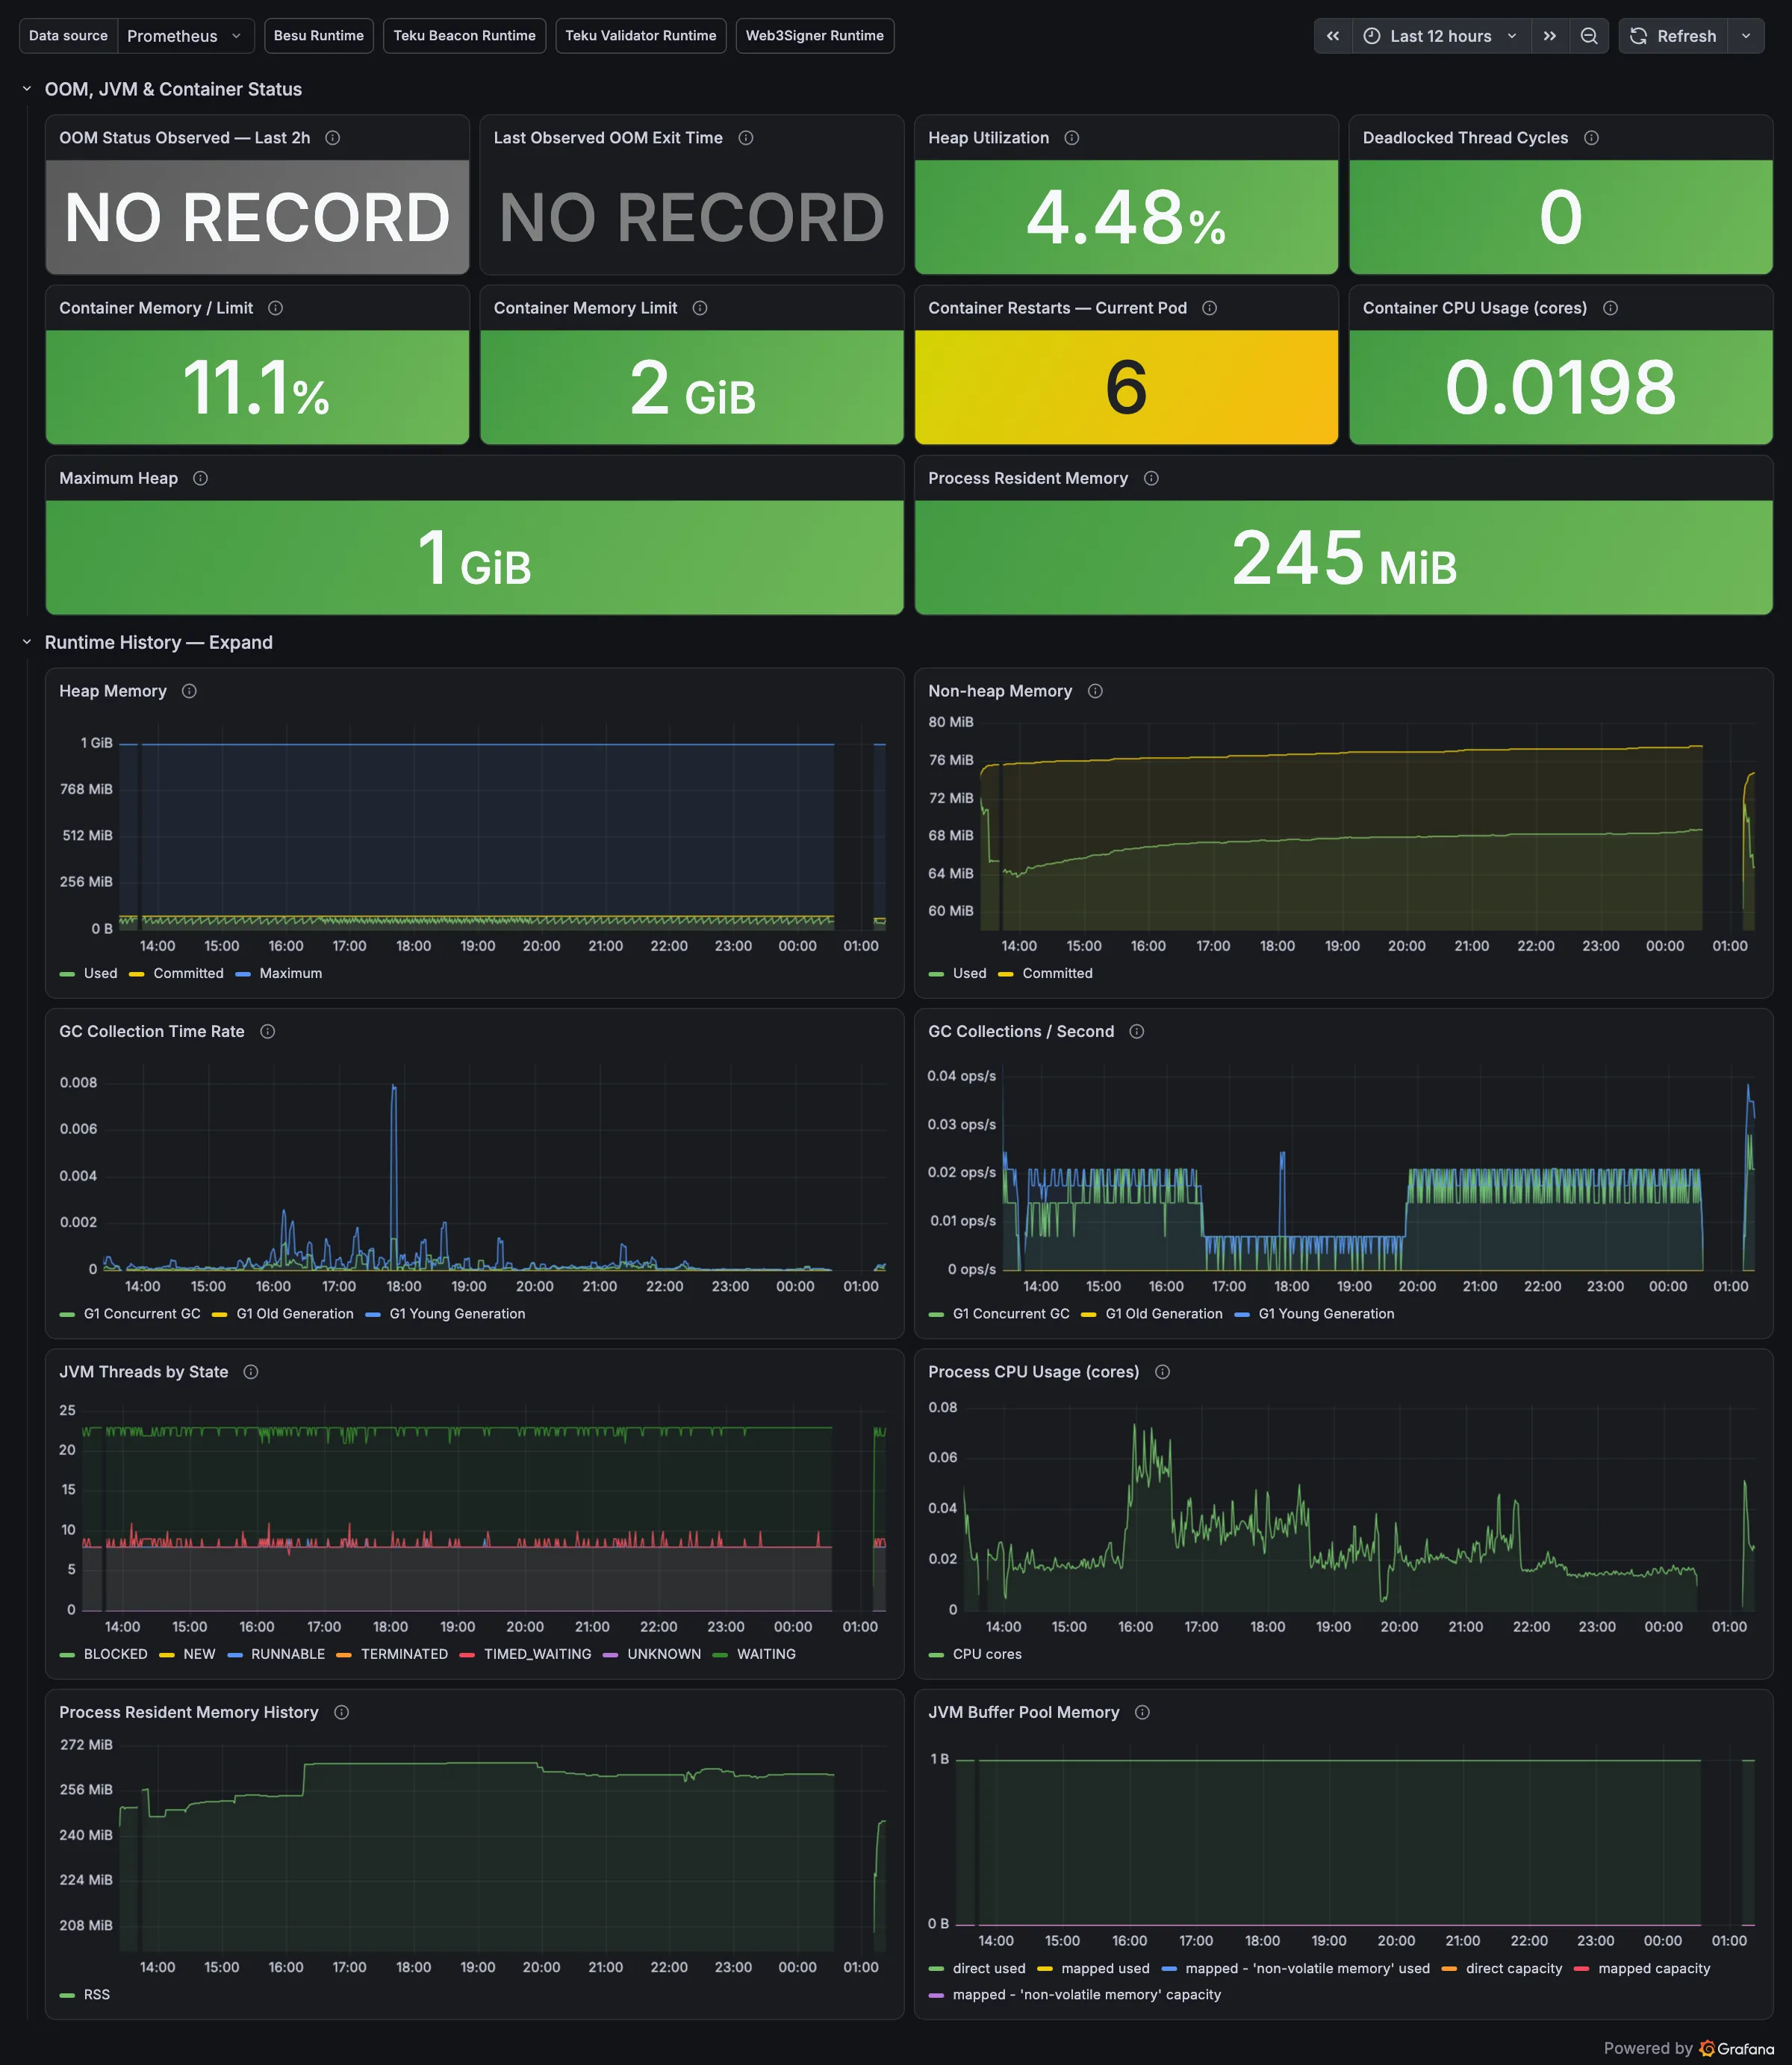
Platform and alerting
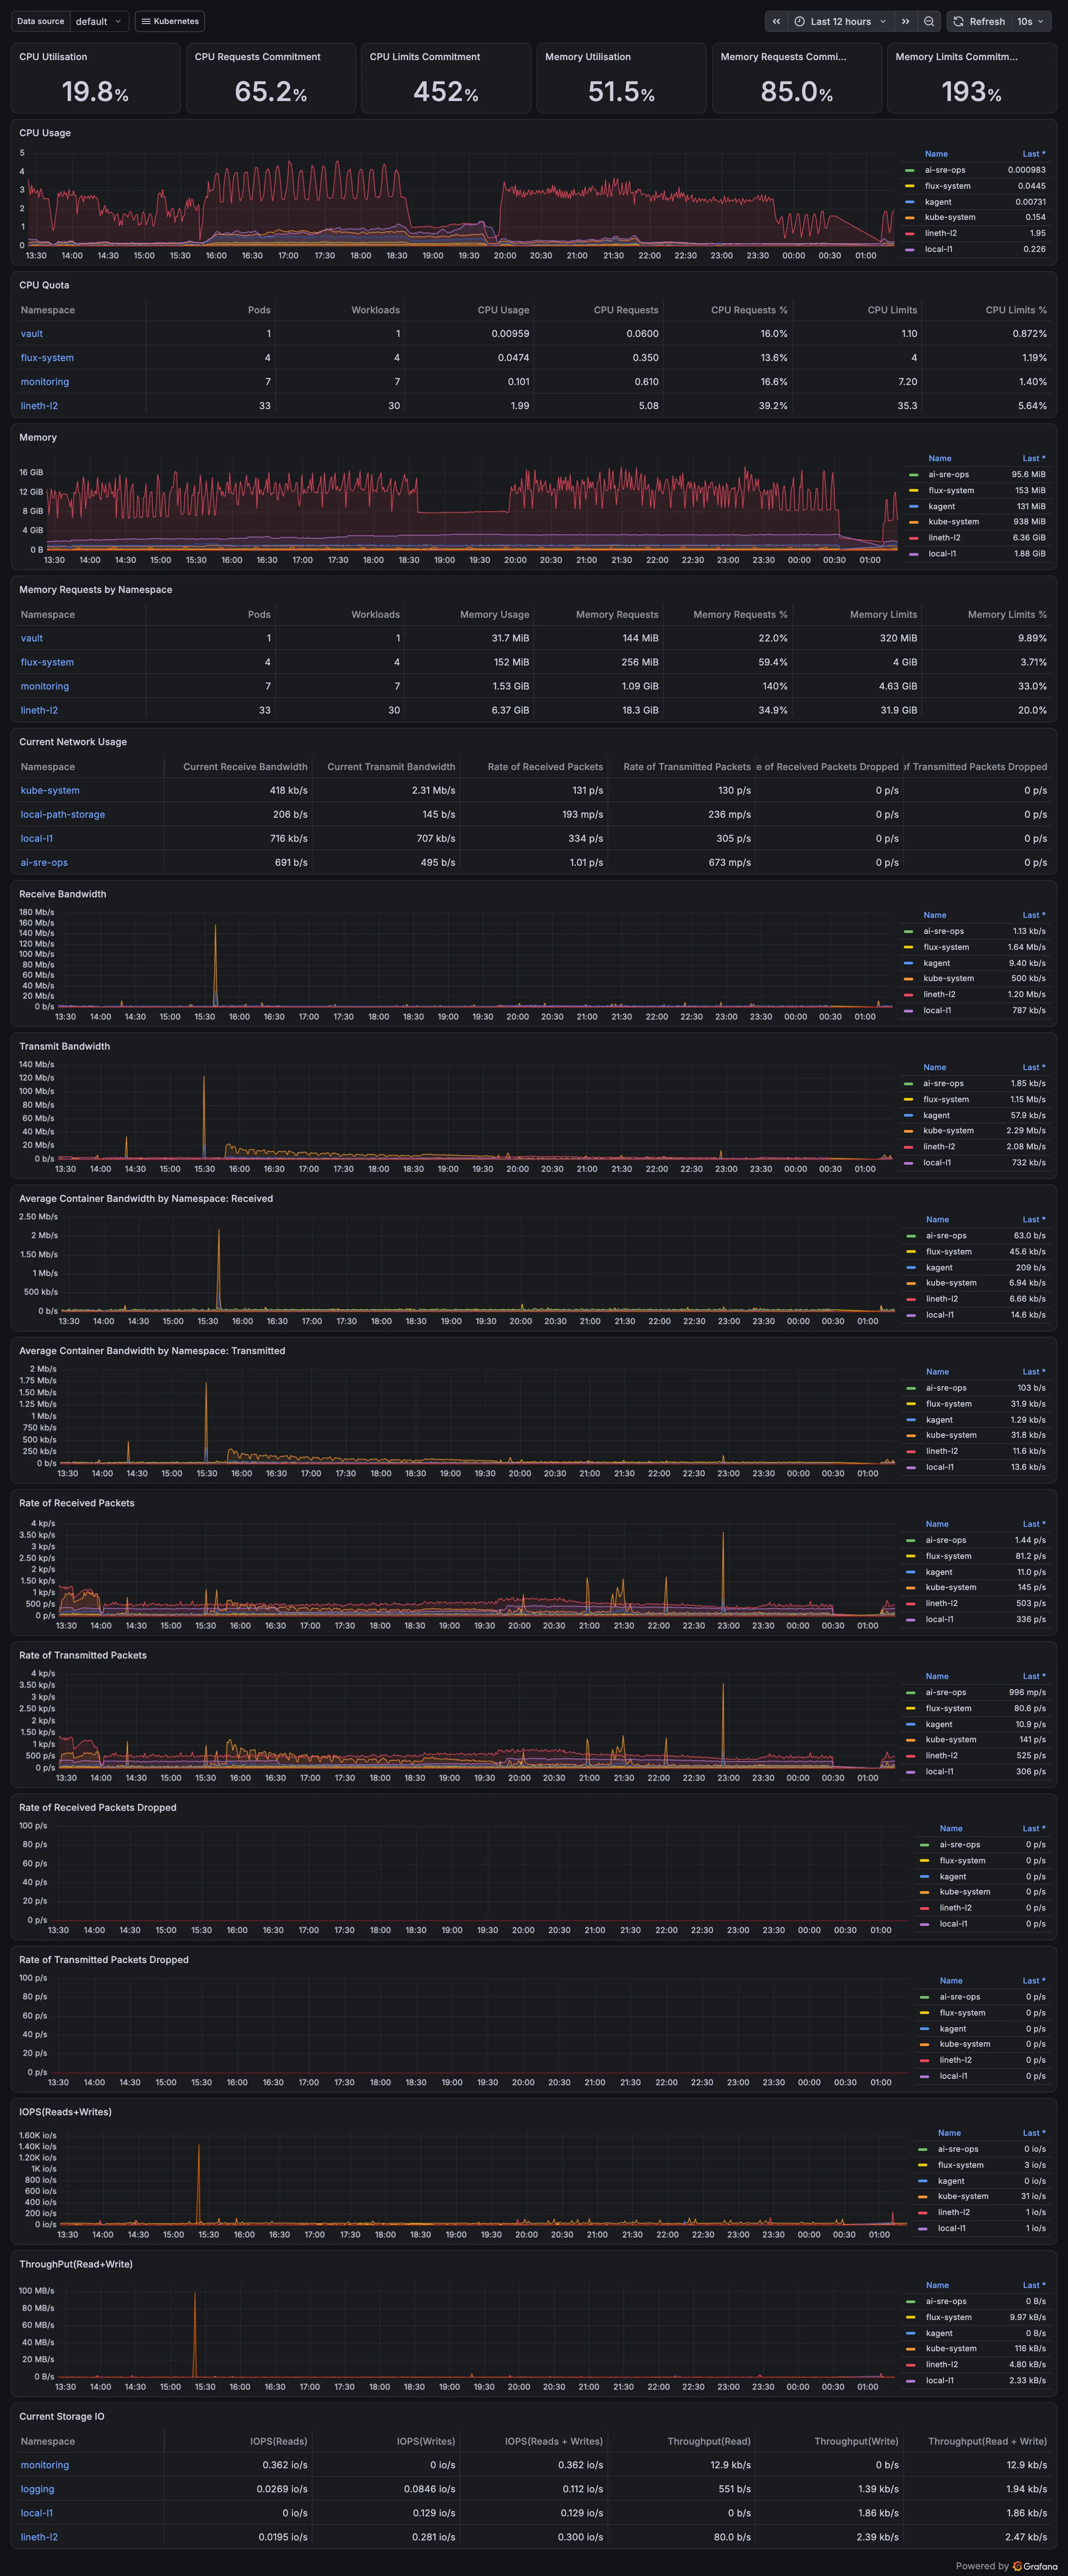
The kube-prometheus-stack defaults cover the cluster itself:
Alerts that reach a person
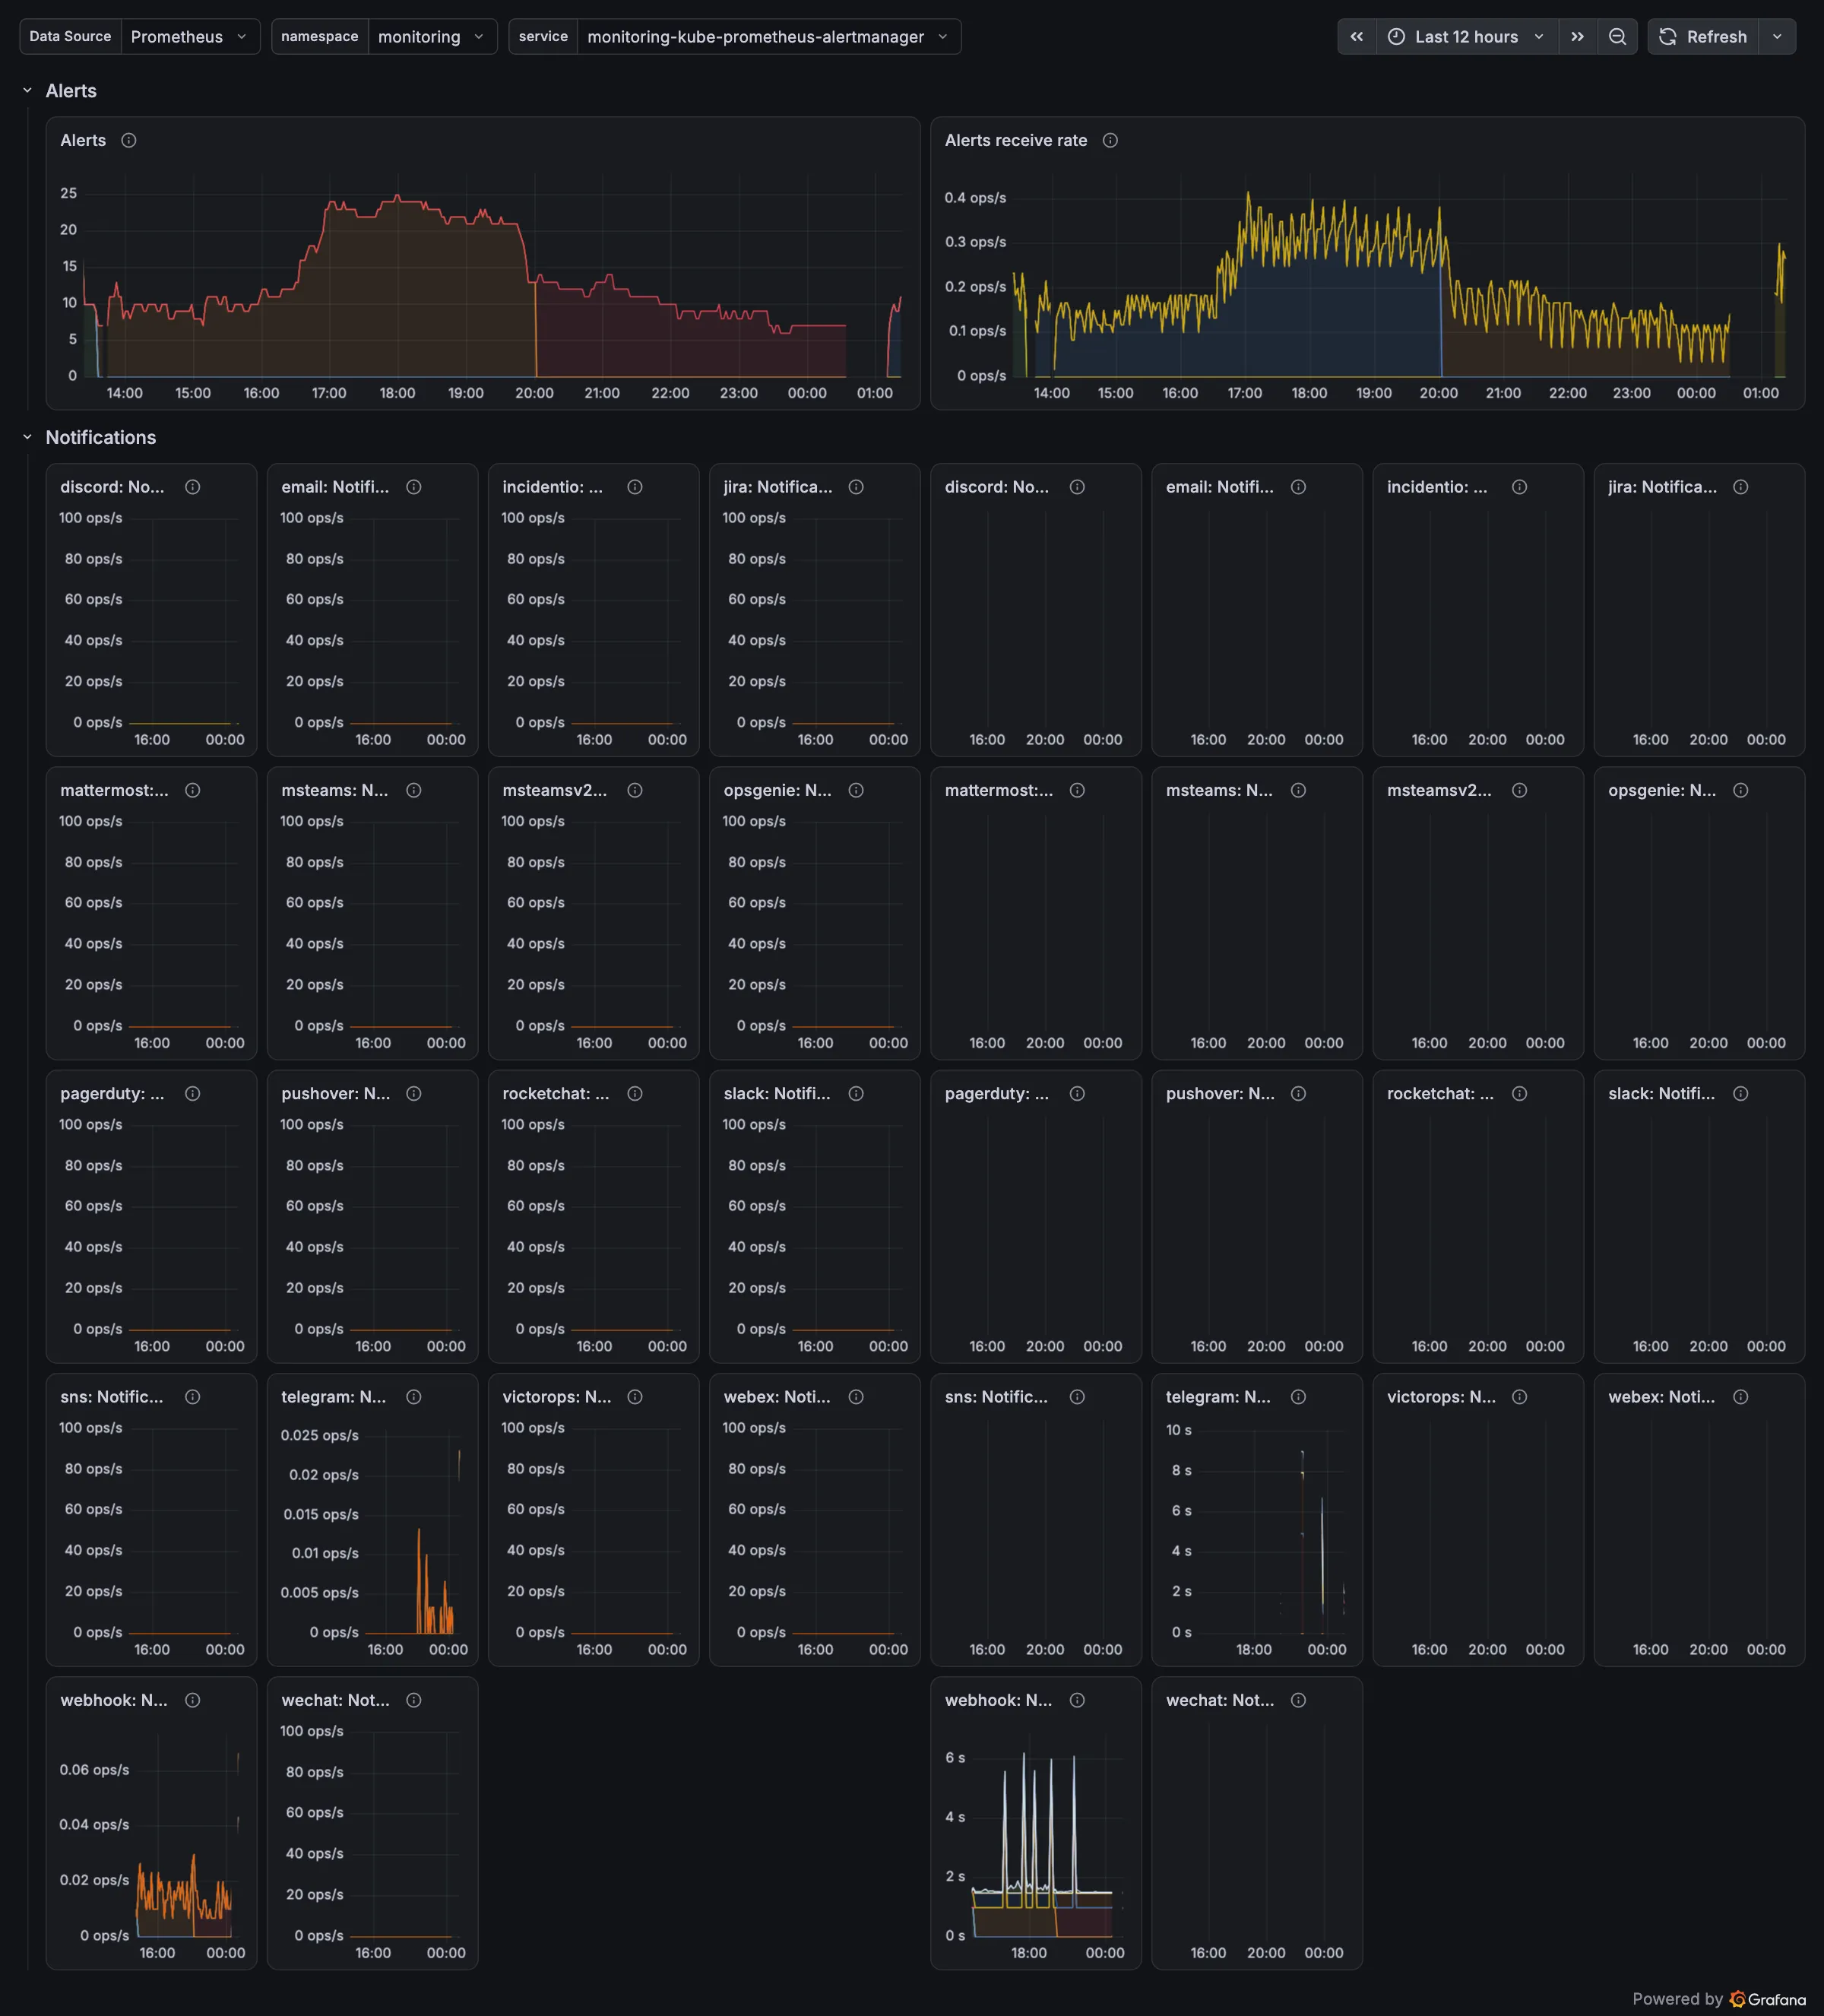
Alerts carry a network label (lineth-local-l1 / lineth-local-l2). Only those are routed; generic kind noise goes to a null receiver. Lab alerts go to three places:
- Telegram, for a person. The bot token and chat id are a SOPS secret mounted as files.
- alert-sink, a log of every notification.
- AI SRE Ops, a console where read-only agents investigate and brief, and a human approves any action.
The Watchdog alert fires all the time and goes to the console every minute; if it stops arriving for 5 minutes, the alert pipeline itself is down.
This last piece came late, and it is the most important lesson of the lab so far. Every postmortem before the Telegram route has the same line in its detection table: the alert fired on time, and nobody saw it. Detection is not done until a person gets the alert.
What’s next
- Fix the SLI blind spots: latency totals on
le="+Inf", count transactions that never complete, and a settlement SLI on lag. - Measure host memory pressure on the Mac. The cluster’s own monitoring cannot see it, and it caused two incidents.
- Longer L1 slots on the next chain reset, to remove the deadlock trigger.